HOT TOPICS LIST
- MACD
- Fibonacci
- RSI
- Gann
- ADXR
- Stochastics
- Volume
- Triangles
- Futures
- Cycles
- Volatility
- ZIGZAG
- MESA
- Retracement
- Aroon
INDICATORS LIST
LIST OF TOPICS
PRINT THIS ARTICLE
by Mike Carr, CMT
Traders often focus on short-term charts but could benefit from looking at weekly and even monthly charts to identify the long-term trend.
Position: Hold
Mike Carr, CMT
Mike Carr, CMT, is a member of the Market Technicians Association, and editor of the MTA's newsletter, Technically Speaking. He is also the author of "Smarter Investing in Any Economy: The Definitive Guide to Relative Strength Investing," and "Conquering the Divide: How to Use Economic Indicators to Catch Stock Market Trends."
PRINT THIS ARTICLE
VOLATILITY
Long-Term Perspective On The S&P 500
01/09/12 02:13:33 PMby Mike Carr, CMT
Traders often focus on short-term charts but could benefit from looking at weekly and even monthly charts to identify the long-term trend.
Position: Hold
| Markets tend to trend for extended periods of time. Uptrends and downtrends are widely anticipated, but markets spend the majority of their time in sideways trends. While the sideways trend could be considered a range-bound or even a trendless market, the knowledge itself that the market is moving sideways is valuable. This type of price action has been considered significant at least since the 1890s, when Charles Henry Dow labeled the sideways trend as a "line." Dow noted that a line could replace a bear market and felt that it served the same purpose as a decline. Later, analysts estimated that markets spend about two-thirds of the time confined to trading ranges, which would make the line the most common market pattern. Since these patterns play out over weeks and months, it is useful to look at long-term charts for perspective even on short-term trades. Long trades are likely to be more successful when the trend is up and short trades should work better in downtrends. Neither side of the market has a real advantage as lines form. |
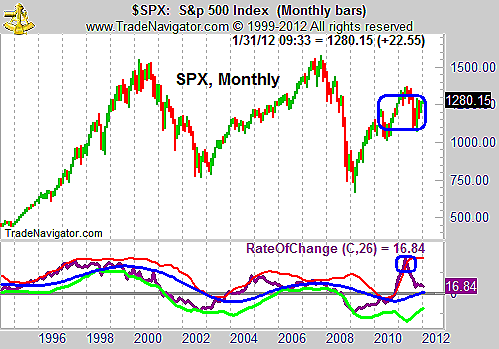
| One way that traders can gain an advantage is by analyzing trendless markets to identify the likely direction of the breakout. Figure 1 shows the monthly chart of the Standard & Poor's 500, which offers a long-term view of a market in a trading range. In particular, over the past year, the market has made very little progress. In 2011, the S&P 500 actually closed unchanged, although investors enjoyed a small gain of about 2% from dividends. Price volatility has decreased and we can see this with narrower price bars. High volatility generally follows low volatility, so the decline in volatility could be a setup for a big price move. |

|
| FIGURE 1: SPX, MONTHLY. The monthly chart of the S&P 500 shows that a trading range, called a line by Charles Dow, has been in place for more than a decade. |
| Graphic provided by: Trade Navigator. |
| |
| Figure 1 includes the rate of change (ROC) with Bollinger Bands added to the indicator. By late 2010, the value of the 26-month ROC was more than 50%, a bubble-like reading. It was also above its upper Bollinger Band. Both situations are seen at overbought extremes, and the steep correction in the ROC has brought the market back into a normal range. Extended periods of negative reading on the 26-month ROC are rare, occurring about 13.7% of the time since 1950. Having seen two such time frames in the past 10 years leads to the conclusion that gains in price are more likely than another bear market. |
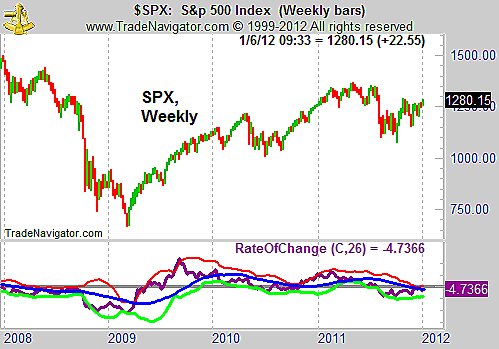
| The weekly chart of the S&P 500 (Figure 2) highlights the contraction in volatility. The Bollinger Bands on the 26-week ROC have shown a tendency to contract and expand and are contracting now. Traders should expect an expansion of the bands to follow and that would be driven by an increase in the value of ROC. In other words, a sharp market move has been set up by the line formation that can be seen on the monthly and weekly charts. |

|
| FIGURE 2: SPX, WEEKLY. On the weekly chart of the S&P 500, volatility has been contracting, indicating that a large price move could be coming soon. |
| Graphic provided by: Trade Navigator. |
| |
| Knowing to expect volatility, traders can then look for clues about whether the move will be up or down. ROC on the monthly chart argues for further gains. The short-term trend on the weekly chart is up, as seen with a series of higher lows in the weekly bars. Short-term traders should have more faith in the success of long stock market trades based on this analysis. |
Mike Carr, CMT, is a member of the Market Technicians Association, and editor of the MTA's newsletter, Technically Speaking. He is also the author of "Smarter Investing in Any Economy: The Definitive Guide to Relative Strength Investing," and "Conquering the Divide: How to Use Economic Indicators to Catch Stock Market Trends."
| Website: | www.moneynews.com/blogs/MichaelCarr/id-73 |
| E-mail address: | marketstrategist@gmail.com |
Click here for more information about our publications!
Comments

Request Information From Our Sponsors
- VectorVest, Inc.
- Executive Premier Workshop
- One-Day Options Course
- OptionsPro
- Retirement Income Workshop
- Sure-Fire Trading Systems (VectorVest, Inc.)
- Trading as a Business Workshop
- VectorVest 7 EOD
- VectorVest 7 RealTime/IntraDay
- VectorVest AutoTester
- VectorVest Educational Services
- VectorVest OnLine
- VectorVest Options Analyzer
- VectorVest ProGraphics v6.0
- VectorVest ProTrader 7
- VectorVest RealTime Derby Tool
- VectorVest Simulator
- VectorVest Variator
- VectorVest Watchdog
- StockCharts.com, Inc.
- Candle Patterns
- Candlestick Charting Explained
- Intermarket Technical Analysis
- John Murphy on Chart Analysis
- John Murphy's Chart Pattern Recognition
- John Murphy's Market Message
- MurphyExplainsMarketAnalysis-Intermarket Analysis
- MurphyExplainsMarketAnalysis-Visual Analysis
- StockCharts.com
- Technical Analysis of the Financial Markets
- The Visual Investor
