HOT TOPICS LIST
- MACD
- Fibonacci
- RSI
- Gann
- ADXR
- Stochastics
- Volume
- Triangles
- Futures
- Cycles
- Volatility
- ZIGZAG
- MESA
- Retracement
- Aroon
INDICATORS LIST
LIST OF TOPICS
PRINT THIS ARTICLE
by Gary Grosschadl
As market excitement builds for the current rally, traders will ponder if this will be a significant run resulting in a trend change or just another bear rally. Here are some parameters to help decipher the market's direction in the short to medium term.
Position: N/A
Gary Grosschadl
Independent Canadian equities trader and technical analyst based in Peterborough
Ontario, Canada.
PRINT THIS ARTICLE
CHART ANALYSIS
Will This Nasdaq/QQQ Rally Last?
05/16/02 12:01:42 PMby Gary Grosschadl
As market excitement builds for the current rally, traders will ponder if this will be a significant run resulting in a trend change or just another bear rally. Here are some parameters to help decipher the market's direction in the short to medium term.
Position: N/A
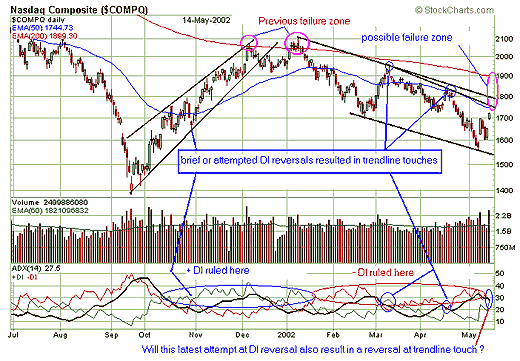
| I've used trendlines, moving averages and directional movement to take a closer look at the Nasdaq. Drawing some simple trendlines reveals a bearish trending channel. The bigger trendline suggests a test at around 1800 whereas the smaller trendline has the touch at about 1750. However there are two more important resistance levels to consider: the 50-day EMA (exponential moving average), and the ominous 200-day EMA. You will note on the chart that two previous "mini rallies" failed at the 50-day EMA line, currently at 1745, so this is likely the first hurdle to overcome. |
| Should this rally have some stronger legs then we come to the more significant test - the 200-day EMA. As a general rule when a stock or index trades under its 200-day moving average, its long term trend is down, and so the bears rule. Healthy stocks/indexes trade above this prominent moving average. The Nasdaq's daily and weekly charts show it below the 200-day EMA (however it may surprise some that the monthly is still above the 200-day EMA of 1450). As shown on the chart, this index has twice battled the 200-day EMA and lost, making the importance of this level readily apparent. |

|
| Graphic provided by: stockcharts.com. |
| |
| I expect one of the trendline resistance levels to repel this latest advance and the 200-day EMA will remain unchallenged for now. But as always the market will have it's own say. |
| Traders familiar with the directional movement indicator may want to take note that there has been some previous trendline touches appearing in conjunction with attempted or brief DI reversals. We are at another one of these junctures. For a lasting trend change this trend strength indicator needs to have another "changing of the guard" whereby the green +DI line stays on top showing positive directional movement similar to the initial run up from September lows. The ideal directional movement set up occurs when +DI is on top and the black ADX line is in the middle and sloping upwards (this shows strong bullish trend strength). With -DI on top we would have strong bearish trend strength. |
Independent Canadian equities trader and technical analyst based in Peterborough
Ontario, Canada.
| Website: | www.whatsonsale.ca/financial.html |
| E-mail address: | gwg7@sympatico.ca |
Click here for more information about our publications!
Comments
Date: 05/17/02Rank: 4Comment:
Date: 05/27/02Rank: 5Comment:
Date: 06/02/02Rank: 5Comment:
Date: 06/02/02Rank: 5Comment:

Request Information From Our Sponsors
- VectorVest, Inc.
- Executive Premier Workshop
- One-Day Options Course
- OptionsPro
- Retirement Income Workshop
- Sure-Fire Trading Systems (VectorVest, Inc.)
- Trading as a Business Workshop
- VectorVest 7 EOD
- VectorVest 7 RealTime/IntraDay
- VectorVest AutoTester
- VectorVest Educational Services
- VectorVest OnLine
- VectorVest Options Analyzer
- VectorVest ProGraphics v6.0
- VectorVest ProTrader 7
- VectorVest RealTime Derby Tool
- VectorVest Simulator
- VectorVest Variator
- VectorVest Watchdog
- StockCharts.com, Inc.
- Candle Patterns
- Candlestick Charting Explained
- Intermarket Technical Analysis
- John Murphy on Chart Analysis
- John Murphy's Chart Pattern Recognition
- John Murphy's Market Message
- MurphyExplainsMarketAnalysis-Intermarket Analysis
- MurphyExplainsMarketAnalysis-Visual Analysis
- StockCharts.com
- Technical Analysis of the Financial Markets
- The Visual Investor
