HOT TOPICS LIST
- MACD
- Fibonacci
- RSI
- Gann
- ADXR
- Stochastics
- Volume
- Triangles
- Futures
- Cycles
- Volatility
- ZIGZAG
- MESA
- Retracement
- Aroon
INDICATORS LIST
LIST OF TOPICS
PRINT THIS ARTICLE
by Chaitali Mohile
Verizon Communications is unable to sustain its new high.
Position: Sell
Chaitali Mohile
Active trader in the Indian stock markets since 2003 and a full-time writer. Trading is largely based upon technical analysis.
PRINT THIS ARTICLE
BREAKOUTS
Breakdown Of Verizon
01/06/12 12:01:39 PMby Chaitali Mohile
Verizon Communications is unable to sustain its new high.
Position: Sell
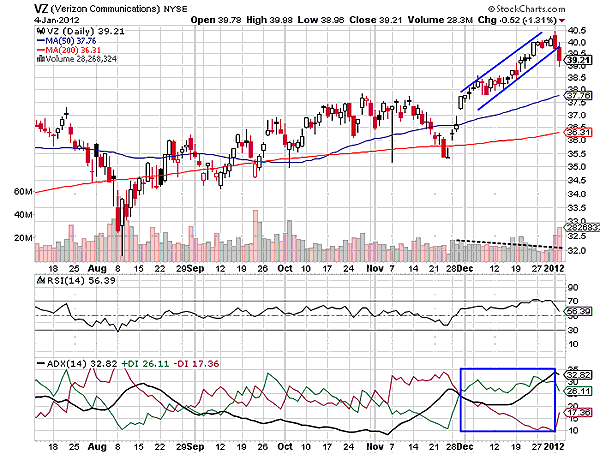
| Verizon Communication (VZ) has surged to a new high at $40. Initially, the rally moved within a robust support-resistance area between the 50-day and 200-day moving averages (MA). The high volatility took prices below the short-term moving average (50-day) support in November 2011. In Figure 1, VZ underwent a small gap down and breached the MA support. However, the 200-day MA extended support to an intermediate descending rally. The newly formed 50-day resistance was converted to support and the price of VZ began its journey towards its new high. VZ made a sharp vertical move, forming a small ascending channel. |

|
| FIGURE 1: VZ, DAILY |
| Graphic provided by: StockCharts.com. |
| |
| Eventually, a fresh uptrend was developed by the new rally. The relative strength index (RSI) (14) surged above the 50 levels, indicating fresh buying opportunity for short-term traders. The indicators and the breakout rally were in perfect sync, but the volumes were shrinking. However, as the price hit the new high at $40, the RSI (14) turned reluctant to surge above the 70 levels, indicating lack of bullish strength. The indicator also showed negative divergence by forming a lower high. The developed uptrend indicated by the average directional index (ADX) (14) is ready to reverse in the middle of the rally. This signifies a possibility of a correction for VZ. Accordingly, the ascending channel has broken the lower trendline support. The bearish breakout would be the best level to go short. Traders need to take fast profits, as the breakout rally would rest with the 50-day MA support. |

|
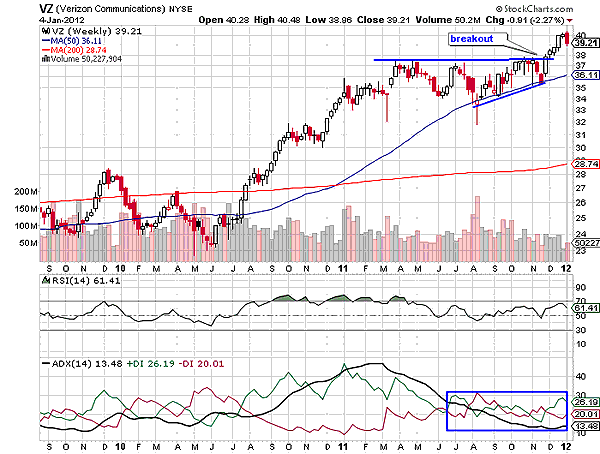
| FIGURE 2: VZ, WEEKLY |
| Graphic provided by: StockCharts.com. |
| |
| On the weekly time frame chart in Figure 2, VZ has formed a long-term bullish flag & pennant -- a bullish continuation pattern. The lower side of the flag has the 50-day MA support. The pattern has already broken upward and has reached its all-time high at $40. Since the breakout occurred on weak signals reflected by the two indicators, it is no surprise that VZ failed to surge higher. The RSI (14) formed lower highs, and the ADX (14) drifted below 15 levels. Both oscillators showed lack of bullish force that affected the breakout rally. Hence, VZ is likely to initiate a new bearish rally. |
| VZ would retrace toward the upper trendline support of the flag and, thereafter, could plunge to the lower support. Thus, both charts of VZ have confirmed the bearish breakout. The initial support of the rally is near 37 on both the time frames; therefore, the stock is unlikely to violate this support. VZ is likely to remain volatile or under bearish control till the robust bullish strength and uptrend are developed. |
| This bearish breakout would turn into serious correction if the 50-day MA support is breached on the daily and weekly time frame charts of VZ. In such a scenario, traders who are already short can carry forward their current position with a stop-loss at the fresh breakdown point to secure the profits. Fresh traders can also trigger short positions below the 50-day MA resistance with more confirmation from the indicators. |
Active trader in the Indian stock markets since 2003 and a full-time writer. Trading is largely based upon technical analysis.
| Company: | Independent |
| Address: | C1/3 Parth Indraprasth Towers. Vastrapur |
| Ahmedabad, Guj 380015 | |
| E-mail address: | chaitalimohile@yahoo.co.in |
Traders' Resource Links | |
| Independent has not added any product or service information to TRADERS' RESOURCE. | |
Click here for more information about our publications!
PRINT THIS ARTICLE

Request Information From Our Sponsors
- StockCharts.com, Inc.
- Candle Patterns
- Candlestick Charting Explained
- Intermarket Technical Analysis
- John Murphy on Chart Analysis
- John Murphy's Chart Pattern Recognition
- John Murphy's Market Message
- MurphyExplainsMarketAnalysis-Intermarket Analysis
- MurphyExplainsMarketAnalysis-Visual Analysis
- StockCharts.com
- Technical Analysis of the Financial Markets
- The Visual Investor
- VectorVest, Inc.
- Executive Premier Workshop
- One-Day Options Course
- OptionsPro
- Retirement Income Workshop
- Sure-Fire Trading Systems (VectorVest, Inc.)
- Trading as a Business Workshop
- VectorVest 7 EOD
- VectorVest 7 RealTime/IntraDay
- VectorVest AutoTester
- VectorVest Educational Services
- VectorVest OnLine
- VectorVest Options Analyzer
- VectorVest ProGraphics v6.0
- VectorVest ProTrader 7
- VectorVest RealTime Derby Tool
- VectorVest Simulator
- VectorVest Variator
- VectorVest Watchdog
