HOT TOPICS LIST
- MACD
- Fibonacci
- RSI
- Gann
- ADXR
- Stochastics
- Volume
- Triangles
- Futures
- Cycles
- Volatility
- ZIGZAG
- MESA
- Retracement
- Aroon
INDICATORS LIST
LIST OF TOPICS
PRINT THIS ARTICLE
by Donald W. Pendergast, Jr.
Stocks making new multimonth highs are always a topic of interest for serious momentum traders.
Position: Accumulate
Donald W. Pendergast, Jr.
Donald W. Pendergast is a financial markets consultant who offers specialized services to stock brokers and high net worth individuals who seek a better bottom line for their portfolios.
PRINT THIS ARTICLE
NEW HIGHS-NEW LOWS
Time To Take (A Long Position In) FITB?
01/05/12 08:42:48 AMby Donald W. Pendergast, Jr.
Stocks making new multimonth highs are always a topic of interest for serious momentum traders.
Position: Accumulate
| In a market that's been as erratic and downright dangerous as this one has been (at least since July 2011), it's always nice to find some stocks that continue to make new multimonth (or even multiyear) highs. Here's a look at one of the larger regional bank stocks' daily chart and the compellingly bullish dynamics that are on display. See Figure 1. |

|
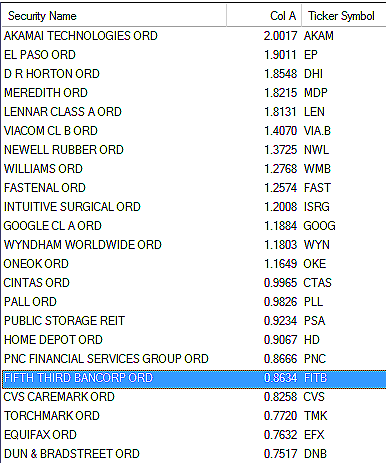
| FIGURE 1: RELATIVE STRENGTH. The top relative strength stocks versus the .SPX that are also making fresh multimonth highs. Fifth Third Bancorp is the top runner in the banking industry group. |
| Graphic provided by: MetaStock. |
| Graphic provided by: MetaStock Explorer. |
| |
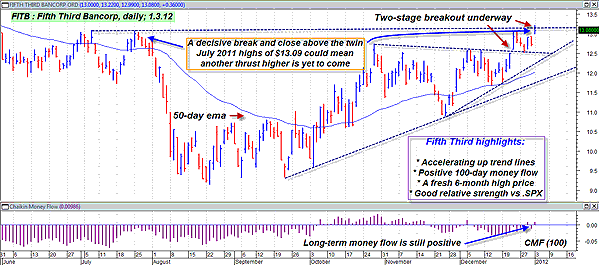
| Glancing at the list of top relative strength (versus the .SPX over the past 13 weeks) large-cap stocks reveals not only that a variety of sectors and groups are represented -- indicating broad market participation -- but that Fifth Third Bancorp (FITB) is the top dog in the banking stock group. Since this list of stocks was located with the assistance of MetaStock's Explorer feature, I ventured a look at FITB's daily chart to see if it was worth further analysis, and it appears that it was certainly worth the time to do so. The first thing you see on most US market stock charts is the dramatic, mindless selling frenzy that threw so many otherwise sound stocks for a loop in summer 2011. By late August/early September, cooler heads prevailed and the big-money interests began positioning themselves for what ultimatley turned into a stunning October rally. FITB definitely made its share of hay while the Indian summer sun was shining, rising from $9.60 to $12.58 in a little more than three weeks. The stock then endured a fairly wild period of consolidation, lasting eight weeks; that ended when the first phase of what appears to be a two-stage breakout took place on December 22, 2011, followed by the January 3, 2012, intraday break above the twin July 2011 highs of $13.09. Since long-term money flow is still positive (based on the 100-period Chaikin money flow histogram [CMF][100]) and the uptrend is accelerating, it seems only logical to assume that many momentum players will be closely monitoring FITB's next attempt to make a daily close above that July 2011 high-water mark of $13.09. Breakouts (in this case, a bullish breakout setup) can be somewhat tricky, especially if the broad market isn't also surging higher, so it's of prime importance to monitor the NYSE TRIN and tick readings before putting on a position near or just after $13.09 is cleared again. Many traders wait for an intraday pullback before attempting to engage a fast moving breakout and then wait for the tick readings to surge upward and the TRIN to start falling as well. Daily based traders can benefit from the same tactic on entry, although there are times when a breakout stock simply doesn't offer a pullback to a price point close to the breakout level -- and a great momentum trade op is forever lost. |

|
| FIGURE 2: FITB, DAILY. Two-stage breakout setups are always exciting to watch as they play out, win or lose. Many momentum players will be watching with interest to see if FITB can finally clear July's high of $13.09 -- and then keep on going. |
| Graphic provided by: MetaStock. |
| Graphic provided by: Deel New Highs screen from MetaStock 11. |
| |
| Tuesday's trading action in the broad markets was very positive in the .SPX and .NDX, but a little less sure in the small-cap area of the market. If the Russell 2000 (.RUT, IWM) can also follow through like its larger-cap brethren did Tuesday, then many of the bullish breakout setups might soon be triggered. See Figure 2. Right now, your job is to start examining not only FITB, but all of the stocks of interest to you on the relative strength list given. You're sure to find at least a couple of nice setups from groups and sectors that you favor if you know what to look for on their daily charts. Take some time to do that and see if it doesn't help you locate potentially profitable chart setups in no time at all. |
Donald W. Pendergast is a financial markets consultant who offers specialized services to stock brokers and high net worth individuals who seek a better bottom line for their portfolios.
| Title: | Writer, market consultant |
| Company: | Linear Trading Systems LLC |
| Jacksonville, FL 32217 | |
| Phone # for sales: | 904-239-9564 |
| E-mail address: | lineartradingsys@gmail.com |
Traders' Resource Links | |
| Linear Trading Systems LLC has not added any product or service information to TRADERS' RESOURCE. | |
Click here for more information about our publications!
PRINT THIS ARTICLE

|

Request Information From Our Sponsors
- StockCharts.com, Inc.
- Candle Patterns
- Candlestick Charting Explained
- Intermarket Technical Analysis
- John Murphy on Chart Analysis
- John Murphy's Chart Pattern Recognition
- John Murphy's Market Message
- MurphyExplainsMarketAnalysis-Intermarket Analysis
- MurphyExplainsMarketAnalysis-Visual Analysis
- StockCharts.com
- Technical Analysis of the Financial Markets
- The Visual Investor
- VectorVest, Inc.
- Executive Premier Workshop
- One-Day Options Course
- OptionsPro
- Retirement Income Workshop
- Sure-Fire Trading Systems (VectorVest, Inc.)
- Trading as a Business Workshop
- VectorVest 7 EOD
- VectorVest 7 RealTime/IntraDay
- VectorVest AutoTester
- VectorVest Educational Services
- VectorVest OnLine
- VectorVest Options Analyzer
- VectorVest ProGraphics v6.0
- VectorVest ProTrader 7
- VectorVest RealTime Derby Tool
- VectorVest Simulator
- VectorVest Variator
- VectorVest Watchdog
