HOT TOPICS LIST
- MACD
- Fibonacci
- RSI
- Gann
- ADXR
- Stochastics
- Volume
- Triangles
- Futures
- Cycles
- Volatility
- ZIGZAG
- MESA
- Retracement
- Aroon
INDICATORS LIST
LIST OF TOPICS
PRINT THIS ARTICLE
by Donald W. Pendergast, Jr.
In the Fidelity Select sector fund universe, the construction and homebuilding fund is now the one with the strongest relative strength versus the broad market.
Position: Accumulate
Donald W. Pendergast, Jr.
Donald W. Pendergast is a financial markets consultant who offers specialized services to stock brokers and high net worth individuals who seek a better bottom line for their portfolios.
PRINT THIS ARTICLE
REL. STR COMPARATIVE
FSHOX From Worst To First
01/04/12 12:42:05 PMby Donald W. Pendergast, Jr.
In the Fidelity Select sector fund universe, the construction and homebuilding fund is now the one with the strongest relative strength versus the broad market.
Position: Accumulate
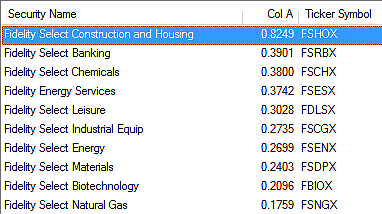
| Anyone who recalls the horror days in the market from late 2007 to early 2009 already knows that the homebuilder stocks were trashed and mostly left for dead by the time that the major market low of March 2009 rolled around. Some stocks in that industry group fared better than others, of course, but for the most part, the group remained at the bottom of the list in terms of 13-week comparative relative strength versus the .SPX -- which is the market index that sets the standard by which most others are judged. But times change, and sometimes the industry groups that were dragging behind start to strengthen, eventually becoming leaders in subsequent market phases. Here's a look at the Fidelity Construction and Housing fund, one of the more recent worst to first turnarounds in the broad US market. See Figure 1. |

|
| FIGURE 1: 10 BEST-PERFORMING SELECT SECTOR FUNDS. Here are the top 10 best-performing Select Sector funds versus the .SPX over the last calendar quarter. |
| Graphic provided by: MetaStock. |
| Graphic provided by: MetaStock Explorer. |
| |
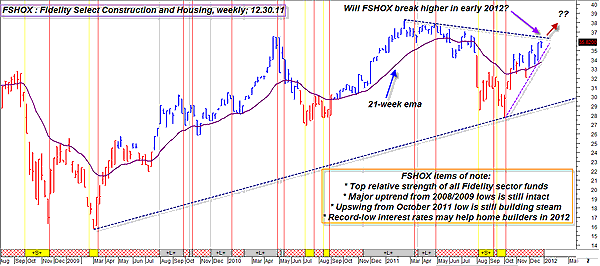
| It's hard to imagine anyone lost money if they bought a home in the late 1990s and sold by the time early to mid-2005 arrived. In some markets, housing prices doubled (or did even better) in the space of a few years, with home valuations spiking higher as interest rates fell in early 2001 and then remained well below historical lows for years afterward. Not surprisingly, homebuilding stocks soared from early 2000 until peaking in June 2007, with FSHOX actually rising more than 275% during that time. Note on the chart how well that the 21-week exponential moving average (EMA) tracks and defines all of the major swings in market moves; each decisive break above/below it was generally followed by a tradable rally or decline (but only if you were holding individual component stocks; you can't actually sell short a Fidelity Select Sector fund). Well, once again, FSHOX is trading above its 21-week EMA, an uptrending move appears to be gathering steam, and the fund also boasts the absolute highest 13-week relative strength of all Select Sector funds versus the .SPX. If you look at the lower portion of the chart, you'll note that the CS Scientific Hybrid trade screen expert is showing a red and white zone, indicating a neutral zone. But if FSHOZ rises for another week or two, don't be surprised to see that ribbon turn gray, indicating that a very strong uptrend is in force. In addition, if you see FSHOX break and then close above the upper resistance line, it could be a very good time to either take a long position in this fund and/or seek out the most attractive homebuilder stocks and then time a long entry into the most technically and fundamentally attractive from that industry group. See Figure 2. |

|
| FIGURE 2: FSHOX, WEEKLY. When a strong relative strength sector fund approaches a key breakout level, smart traders will want to prepare a shopping list of attractive component stocks, some of which can, at times, move farther and faster than their parent sector fund or industry group ETF. |
| Graphic provided by: MetaStock. |
| Graphic provided by: CS Scientific Hybrid trade screen from MetaStock. |
| |
| Here is a brief list of stocks from the homebuilder/construction group, based on their comparative relative strength; these are the ticker symbols of the stocks outperforming the .SPX over the past calendar quarter: BZH, MHO, PHM, MTH, RYL, LEN, TOL, DHI, HOV If you are serious about latching onto stocks from a strong industry group, then by all means take the time to plot these stocks in your own charting software, noting their trend, support/resistance zones and money flow histograms, and then see if you can't spot a suitable long entry point in the ones you are most comfortable with. With a brand-new year of trading action all ready to go, learning to spot and then stay with the stocks in the strongest groups could help make 2012 one of your best trading years ever. |
Donald W. Pendergast is a financial markets consultant who offers specialized services to stock brokers and high net worth individuals who seek a better bottom line for their portfolios.
| Title: | Writer, market consultant |
| Company: | Linear Trading Systems LLC |
| Jacksonville, FL 32217 | |
| Phone # for sales: | 904-239-9564 |
| E-mail address: | lineartradingsys@gmail.com |
Traders' Resource Links | |
| Linear Trading Systems LLC has not added any product or service information to TRADERS' RESOURCE. | |
Click here for more information about our publications!
PRINT THIS ARTICLE

Request Information From Our Sponsors
- StockCharts.com, Inc.
- Candle Patterns
- Candlestick Charting Explained
- Intermarket Technical Analysis
- John Murphy on Chart Analysis
- John Murphy's Chart Pattern Recognition
- John Murphy's Market Message
- MurphyExplainsMarketAnalysis-Intermarket Analysis
- MurphyExplainsMarketAnalysis-Visual Analysis
- StockCharts.com
- Technical Analysis of the Financial Markets
- The Visual Investor
- VectorVest, Inc.
- Executive Premier Workshop
- One-Day Options Course
- OptionsPro
- Retirement Income Workshop
- Sure-Fire Trading Systems (VectorVest, Inc.)
- Trading as a Business Workshop
- VectorVest 7 EOD
- VectorVest 7 RealTime/IntraDay
- VectorVest AutoTester
- VectorVest Educational Services
- VectorVest OnLine
- VectorVest Options Analyzer
- VectorVest ProGraphics v6.0
- VectorVest ProTrader 7
- VectorVest RealTime Derby Tool
- VectorVest Simulator
- VectorVest Variator
- VectorVest Watchdog
