

HOT TOPICS LIST
- MACD
- Fibonacci
- RSI
- Gann
- ADXR
- Stochastics
- Volume
- Triangles
- Futures
- Cycles
- Volatility
- ZIGZAG
- MESA
- Retracement
- Aroon
INDICATORS LIST
LIST OF TOPICS
PRINT THIS ARTICLE
by Mike Carr, CMT
The stochastics indicator is usually applied to closing price data but it can be calculated using indicators such as the relative strength index, making those indicators more valuable in many cases.
Position: Buy
Mike Carr, CMT
Mike Carr, CMT, is a member of the Market Technicians Association, and editor of the MTA's newsletter, Technically Speaking. He is also the author of "Smarter Investing in Any Economy: The Definitive Guide to Relative Strength Investing," and "Conquering the Divide: How to Use Economic Indicators to Catch Stock Market Trends."
PRINT THIS ARTICLE
STOCHASTICS
Adding Stochastics To Indicators
01/04/12 10:59:33 AMby Mike Carr, CMT
The stochastics indicator is usually applied to closing price data but it can be calculated using indicators such as the relative strength index, making those indicators more valuable in many cases.
Position: Buy
| There are many times when an indicator will be difficult to interpret. Backtested results often show that relative strength index (RSI) is one of the most reliable indicators, but RSI may not always give precise buy & sell signals when the trader is looking to trade a market. The indicator can become range bound and trendless for months at a time. RSI is usually interpreted as an overbought/oversold indicator. If the indicator is calculated over a 14-period lookback window, the default settings in many trading software packages, when the value of the indicator rises above 70, a market is considered overbought, and traders often sell their positions or go short when the indicator falls back below 70. For buy signals, a value of 30 is often used to indicate an oversold market. There are countless variations on this idea, including using a shorter lookback window (even as little as two periods) and different levels to take action (such as 95 for overbought and 5 for oversold signals). |
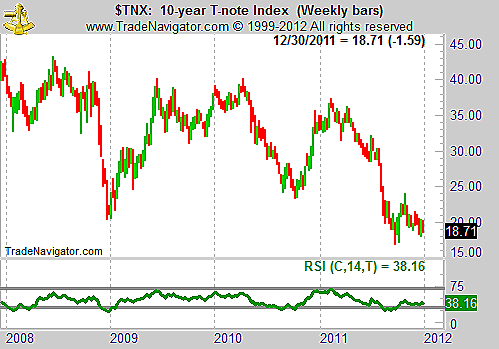
| As valuable as RSI signals can be for traders, there are those extended periods of time when the indicator does not offer a clear trade signal. Without clear and timely signals, it is possible to have a significant move without RSI ever reaching an extreme and offering a signal. Figure 1 shows the interest rate on the 10-year Treasury note. Bonds were among the best investment performers in 2011, but traders using solely RSI would have missed out on the trade. The peak in RSI came in early 2011 at 69.3, just shy of the overbought level. RSI did trend lower throughout the year along with the interest rate, and in hindsight, many traders would say that 69.3 was close enough to a sell signal, but if they were disciplined and rule-based traders, they would have missed this move. |
|
| FIGURE 1: TNX, WEEKLY. Interest rates on the 10-year Treasury note fell to record lows without ever offering a sell signal based on RSI. |
| Graphic provided by: Trade Navigator. |
| |
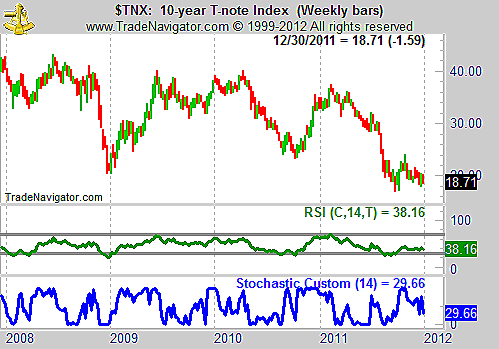
| Any indicator can be changed into a stochastic. The formula for stochastics is usually applied to closing prices, but the calculation can be applied to any data series. It is used to offer context as to whether the current value is high or low on a relative basis. Some market analysts, including Larry Williams and John Bollinger, have highlighted this in their work over the years. In Figure 2, the stochastics formula is applied to the RSI. |
|
| FIGURE 2: TNX, WEEKLY. RSI is shown in the middle of the chart and the stochastic calculated with RSI is shown in the lower part of the chart. |
| Graphic provided by: Trade Navigator. |
| |
| Applied to RSI, the stochastic offers more frequent signals and the signals offered are clearer. With stochastics, overbought and oversold levels of 80 and 20 are usually used. These levels offered five trading signals in 2011. This is best thought of as a short-term strategy rather than an always-in-the-market trading approach. The signals occur much more frequently than those based solely on RSI and they tend to identify short-term moves. A time exit, closing a position two weeks after the signal, for example, would be a better way to implement this strategy. |
|
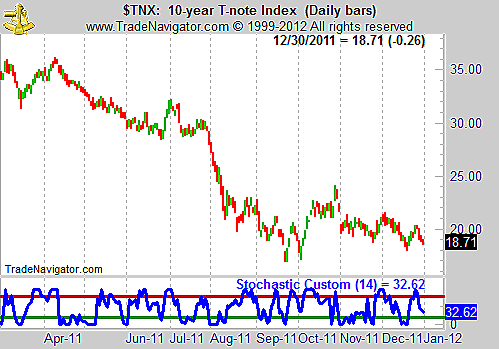
| FIGURE 3: TNX, DAILY. The daily chart shows that this indicator can help traders spot short-term trend reversals. |
| Graphic provided by: Trade Navigator. |
| |
| This strategy is shown with daily data in Figure 3. Signals are frequent, occurring about twice a month on average. They correctly identify very short-term turning points almost 60% of the time. With additional rules, applying the stochastic formula to RSI can be the basis of a profitable trading strategy. |
Mike Carr, CMT, is a member of the Market Technicians Association, and editor of the MTA's newsletter, Technically Speaking. He is also the author of "Smarter Investing in Any Economy: The Definitive Guide to Relative Strength Investing," and "Conquering the Divide: How to Use Economic Indicators to Catch Stock Market Trends."
| Website: | www.moneynews.com/blogs/MichaelCarr/id-73 |
| E-mail address: | marketstrategist@gmail.com |
Click here for more information about our publications!
Comments

Request Information From Our Sponsors
- StockCharts.com, Inc.
- Candle Patterns
- Candlestick Charting Explained
- Intermarket Technical Analysis
- John Murphy on Chart Analysis
- John Murphy's Chart Pattern Recognition
- John Murphy's Market Message
- MurphyExplainsMarketAnalysis-Intermarket Analysis
- MurphyExplainsMarketAnalysis-Visual Analysis
- StockCharts.com
- Technical Analysis of the Financial Markets
- The Visual Investor
- VectorVest, Inc.
- Executive Premier Workshop
- One-Day Options Course
- OptionsPro
- Retirement Income Workshop
- Sure-Fire Trading Systems (VectorVest, Inc.)
- Trading as a Business Workshop
- VectorVest 7 EOD
- VectorVest 7 RealTime/IntraDay
- VectorVest AutoTester
- VectorVest Educational Services
- VectorVest OnLine
- VectorVest Options Analyzer
- VectorVest ProGraphics v6.0
- VectorVest ProTrader 7
- VectorVest RealTime Derby Tool
- VectorVest Simulator
- VectorVest Variator
- VectorVest Watchdog