HOT TOPICS LIST
- MACD
- Fibonacci
- RSI
- Gann
- ADXR
- Stochastics
- Volume
- Triangles
- Futures
- Cycles
- Volatility
- ZIGZAG
- MESA
- Retracement
- Aroon
INDICATORS LIST
LIST OF TOPICS
PRINT THIS ARTICLE
by Billy Williams
The market has shown signs of life, but you need to know how to navigate tomorrow's rough waters if you want to profit and, more important, how to avoid unnecessary losses.
Position: Hold
Billy Williams
Billy Williams has been trading the markets for 27 years, specializing in momentum trading with stocks and options.
PRINT THIS ARTICLE
TECHNICAL ANALYSIS
Navigating Rough Waters In Tomorrow's Market
01/03/12 12:48:36 PMby Billy Williams
The market has shown signs of life, but you need to know how to navigate tomorrow's rough waters if you want to profit and, more important, how to avoid unnecessary losses.
Position: Hold
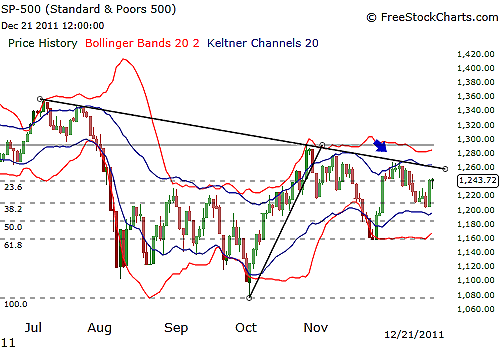
| One hundred and thirty-four. That's how many points the SPX has been trading back and forth within a defined trading range since late October 2011. Further, it must remain within that range as the global markets have tried to adjust for any hope of European austerity measures being reached as well as an agreement on the US budget on the part of its government in the near future. Sadly, both of these aspirations have fallen flat and the specter of the debt crisis that looms over the European Union's horizon still threatens to cast its shadow not just over the US but the world economy. |

|
| FIGURE 1: SPX. The SPX has traded within a tight trading range for the last two months but has encountered resistance at several points. |
| Graphic provided by: www.freestockcharts.com. |
| |
| On October 4, 2011, the SPX found its bottom after having experienced a strong period of price contraction that resulted in a trading range being formed from August 9, 2011, to the significant low set in early October. The trading range formed as support settled into the market after a steep decline. The market reversed course and headed into a steep decline off a lower high that was established on July 21, 2011, followed by price falling by 246 points in little more than two weeks where a significant price low was formed on August 9, 2011, at around 1101. For the next two months, the SPX entered a period of extreme price contraction where a trading range was formed until it set a new price low but found support on October 4, 2011. From that low of around 1075, the SPX found its legs, and in just a little more than three weeks went on to rally more than 220 points all the way up to and through its 200-day SMA. However, at this level, price could not gather enough bulls to help it stay afloat; it began to pull back slightly into a shallow pullback but then formed a lower high in price and began to enter a period of price contraction again. |

|
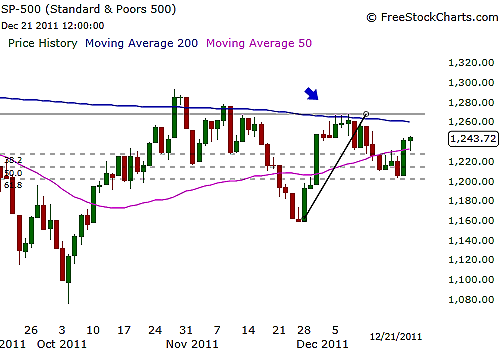
| FIGURE 2: SPX. The 200-day SMA has proven to be formidable resistance to the SPX's attempts to get above its downslope, but the shallow retracement off the last price leg up may indicate that the index is gathering steam to pierce through that resistance and begin trending upward once again. |
| Graphic provided by: www.freestockcharts.com. |
| |
| The market began to decline and eventually retraced back to a 0.618 Fibonacci retracement level, which indicated that while price might manage to rally again, it was unlikely to rally up to and past its significant price high set on October 27, 2011, at around 1292. But it did indicate that it might retrace its decline enough in order to pull back again and then attempt a rally to take out that high if the market could find its legs again as the end of 2012 approached. In early December 2011, the SPX's price action touched the 200-day SMA for three consecutive trading days, but the moving average proved to be a strong resistance at this time for the SPX to overcome it. Price then declined as expected but only retraced to a 0.50 Fibonacci retracement level, which is considered a shallow retracement and could begin to rally from that point and go on to challenge the 1292 price level. It only needed the bulls to enter in force and take control of the trend, which appeared to have occurred on December 20, 2011. |

|
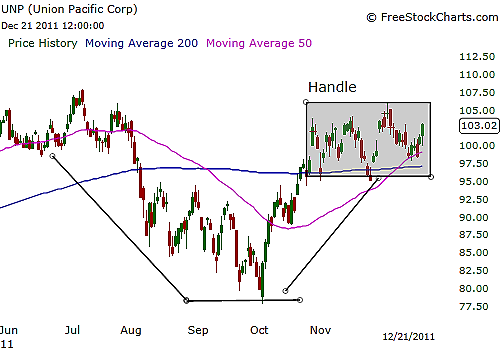
| FIGURE 3: SPX. The UNP is a large-cap company that has key fundamental and technical factors going for it as it forms a bullish cup & handle pattern, but the devil is in the details. Those details should cause you to hesitate entering into this stock and look for more fertile ground in an emerging stock leader elsewhere in the market. |
| Graphic provided by: www.freestockcharts.com. |
| |
| At this present level within the SPX, a bottom could form in the form of an O'Neil follow-through day if price can experience a 1% or greater rally on volume greater than the previous day. It is at this key juncture in the context of the market that any possible hope for a year-end rally could occur. That said, stocks that have high relative strength have still formed entry points and bullish chart patterns during this latest period of price contraction, but now is not the time to consider buying stocks while the market is so apparently undecided about which direction it wants to go. The only productive thing that can be prudent to do in this climate is to start making a list of outstanding stocks with the potential to emerge as leaders that could take the market higher if a rally forms. However, you need to select stocks that not only have compelling fundamental and technical factors but have not had the majority of their outstanding shares gobbled up by large institutions while preferring stocks that have a stock float of greater than 20 million shares. Avoiding stocks like Union Pacific Corp. (UNP), which have 85% of their shares controlled by large institutions as well as a stock float of 481 million shares, leaves the stock's price action at the mercy of the whims of these institutions with little upside potential, since it takes so much buying to move the stock higher. |
| For now, knowing how the market got to its current state and defining what that means for you is crucial as one year ends and a new one begins. The year 2011 started with much promise and, from a statistical and historical perspective, had a lot of potential. But now, with fear creeping into every corner of the market as the debt crisis in Europe looms and, worse, an uncertain future for North Korea could have serious repercussions for the Korean peninsula. The year 2012 may carry some new uncertainties. One thing is certain: price may contract or expand, it may trade within a price range or trend higher/lower, but for a smart trader, money is always ready to be made if you spend time doing the drudgery of preparing for tomorrow's events based on the study of yesterday's price action. |
Billy Williams has been trading the markets for 27 years, specializing in momentum trading with stocks and options.
| Company: | StockOptionSystem.com |
| E-mail address: | stockoptionsystem.com@gmail.com |
Traders' Resource Links | |
| StockOptionSystem.com has not added any product or service information to TRADERS' RESOURCE. | |
Click here for more information about our publications!
PRINT THIS ARTICLE

|

Request Information From Our Sponsors
- StockCharts.com, Inc.
- Candle Patterns
- Candlestick Charting Explained
- Intermarket Technical Analysis
- John Murphy on Chart Analysis
- John Murphy's Chart Pattern Recognition
- John Murphy's Market Message
- MurphyExplainsMarketAnalysis-Intermarket Analysis
- MurphyExplainsMarketAnalysis-Visual Analysis
- StockCharts.com
- Technical Analysis of the Financial Markets
- The Visual Investor
- VectorVest, Inc.
- Executive Premier Workshop
- One-Day Options Course
- OptionsPro
- Retirement Income Workshop
- Sure-Fire Trading Systems (VectorVest, Inc.)
- Trading as a Business Workshop
- VectorVest 7 EOD
- VectorVest 7 RealTime/IntraDay
- VectorVest AutoTester
- VectorVest Educational Services
- VectorVest OnLine
- VectorVest Options Analyzer
- VectorVest ProGraphics v6.0
- VectorVest ProTrader 7
- VectorVest RealTime Derby Tool
- VectorVest Simulator
- VectorVest Variator
- VectorVest Watchdog
