HOT TOPICS LIST
- MACD
- Fibonacci
- RSI
- Gann
- ADXR
- Stochastics
- Volume
- Triangles
- Futures
- Cycles
- Volatility
- ZIGZAG
- MESA
- Retracement
- Aroon
INDICATORS LIST
LIST OF TOPICS
PRINT THIS ARTICLE
by Chaitali Mohile
Costco Wholesale Corp. is showing weakness even after a bullish rally. Will the stock break downward?
Position: N/A
Chaitali Mohile
Active trader in the Indian stock markets since 2003 and a full-time writer. Trading is largely based upon technical analysis.
PRINT THIS ARTICLE
CHART ANALYSIS
COST Breaking Down?
01/03/12 12:26:49 PMby Chaitali Mohile
Costco Wholesale Corp. is showing weakness even after a bullish rally. Will the stock break downward?
Position: N/A
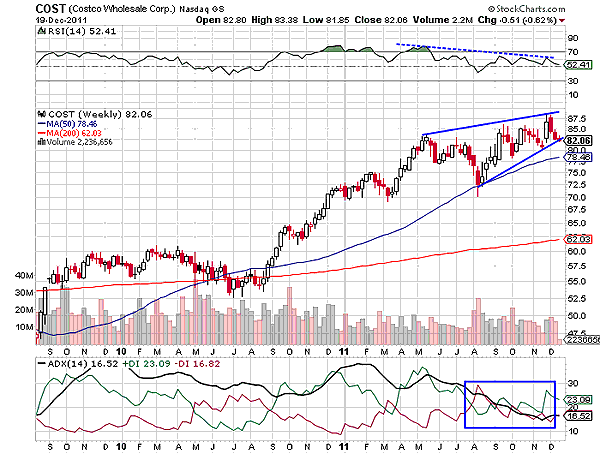
| After an exclusive advance rally, Costco Wholesale Corp. (COST) is forming a rising wedge on the weekly time frame chart in Figure 1. During the rally, price retraced to the immediate support of 50-day moving average (MA). COST failed to regain its previous bullish strength, resulting in the formations of lower highs and higher lows. Although the stock price formed a new high, the price action formed the rising wedge -- a bearish reversal formation. The relative strength index (RSI) (14) is showing a negative divergence with respect to the price rally. This indicates that the rising wedge is likely to break downward, initiating a fresh bearish rally for COST. We can see that price has hit the lower trendline support of the wedge in Figure 1. The volume has turned volatile, and the average directional index (ADX) (14) has slipped below 20 levels. |

|
| FIGURE 1: COST, WEEKLY |
| Graphic provided by: StockCharts.com. |
| |
| Hence, COST is ready to break the rising wedge formation. However, the first robust support of the 50-day MA would protect the bearish rally. In the meantime, if the strength indicator breaches the center line (50 levels) support, and the selling pressure on the weakening trend increases, then COST can violate even the 50-day MA support. A glance at the price chart in Figure 1 shows a large bullish flag & pennant formation. The rising wedge looks like a pennant, but the weak indicators would unnerve any bullish breakout. |
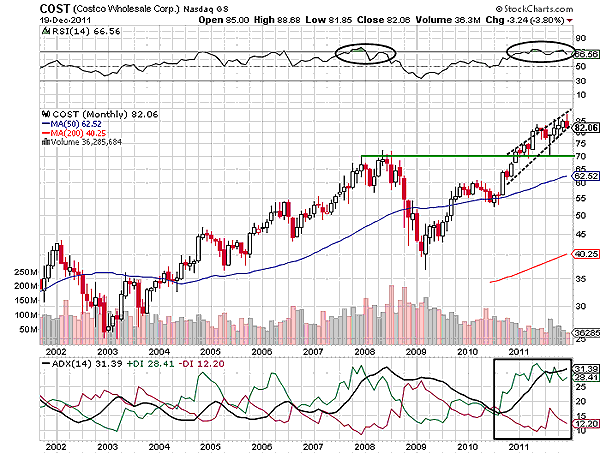
| In 2008, the long-term rally of COST reversed from 70 levels. Due to a fresh bearish rally, a strong psychological resistance was developed. The RSI (14) formed negative divergence in 2008; as a result, the bullish move changed its direction. The stock immediately recovered, converting the 50-day MA resistance to support. Due to a developing uptrend in Figure 2, the previous high (70) resistance was violated without any difficulty. The ADX (14) and RSI (14) surged in the bulls' favor, dragging the price action at the new high. The resistance breakout at 70 levels was the best buying opportunity for traders and investors. However, the volume failed to rise, suggesting lack of confidence in the rally. Eventually, the upward movement slowed down. We can see a few doji candlesticks and the small bullish candles with upper shadows. |

|
| FIGURE 2: COST, MONTHLY |
| Graphic provided by: StockCharts.com. |
| |
| Although the uptrend was developed, the RSI (14) formed a short-term double top in Figure 2. The double top suggested weakening bullish pressure on the rally, and COST began to move in a narrowing range. Since the ADX (14) is moving vertically upward, and the RSI (14) has not yet slipped below bullish support of 50 levels, traders have to be watchful for the breakdown. Neither indicator can ride the rally in isolation. The long-term bearish breakout would occur only if both indicators turned bearish. Thus, a confirmed breakdown signal is essential. |
| As the overall equity market trend is bearish, COST would definitely break down. To conclude, the rising wedge breakdown would reverse the current bullish trend of COST in the next few months. |
Active trader in the Indian stock markets since 2003 and a full-time writer. Trading is largely based upon technical analysis.
| Company: | Independent |
| Address: | C1/3 Parth Indraprasth Towers. Vastrapur |
| Ahmedabad, Guj 380015 | |
| E-mail address: | chaitalimohile@yahoo.co.in |
Traders' Resource Links | |
| Independent has not added any product or service information to TRADERS' RESOURCE. | |
Click here for more information about our publications!
PRINT THIS ARTICLE

Request Information From Our Sponsors
- StockCharts.com, Inc.
- Candle Patterns
- Candlestick Charting Explained
- Intermarket Technical Analysis
- John Murphy on Chart Analysis
- John Murphy's Chart Pattern Recognition
- John Murphy's Market Message
- MurphyExplainsMarketAnalysis-Intermarket Analysis
- MurphyExplainsMarketAnalysis-Visual Analysis
- StockCharts.com
- Technical Analysis of the Financial Markets
- The Visual Investor
- VectorVest, Inc.
- Executive Premier Workshop
- One-Day Options Course
- OptionsPro
- Retirement Income Workshop
- Sure-Fire Trading Systems (VectorVest, Inc.)
- Trading as a Business Workshop
- VectorVest 7 EOD
- VectorVest 7 RealTime/IntraDay
- VectorVest AutoTester
- VectorVest Educational Services
- VectorVest OnLine
- VectorVest Options Analyzer
- VectorVest ProGraphics v6.0
- VectorVest ProTrader 7
- VectorVest RealTime Derby Tool
- VectorVest Simulator
- VectorVest Variator
- VectorVest Watchdog
