HOT TOPICS LIST
- MACD
- Fibonacci
- RSI
- Gann
- ADXR
- Stochastics
- Volume
- Triangles
- Futures
- Cycles
- Volatility
- ZIGZAG
- MESA
- Retracement
- Aroon
INDICATORS LIST
LIST OF TOPICS
PRINT THIS ARTICLE
by Ranjan Jha, CMT
Earnings have been impressive, but stocks seem to be struggling. Let's have a closer look.
Position: N/A
Ranjan Jha, CMT
I am a member of the Market Technicians Association and manage a limited partnership investment club in Virginia. Always seek advice from your own Financial Advisor before acting on any method outlined here since every circumstance is different.
PRINT THIS ARTICLE
BULL/BEAR MARKET
Beware The Bear
12/20/11 03:04:38 PMby Ranjan Jha, CMT
Earnings have been impressive, but stocks seem to be struggling. Let's have a closer look.
Position: N/A
| This was supposed to be a seasonally bullish phase, but surely it does not feel like it. All major stock market indexes are below their respective 200-day moving averages (DMA). Moreover, 200 DMA for the broader and widely held S&P 500 SPDR ETF (SPY) is trending down. The market has been swinging wildly from day to day, with Dow Jones Industrial Average (DJIA) making triple-digit moves up and down frequently of late. With this increased daily volatility, it's worth looking at a few weekly charts to see if we can discern a clearer picture. This article is just an attempt to do that. |
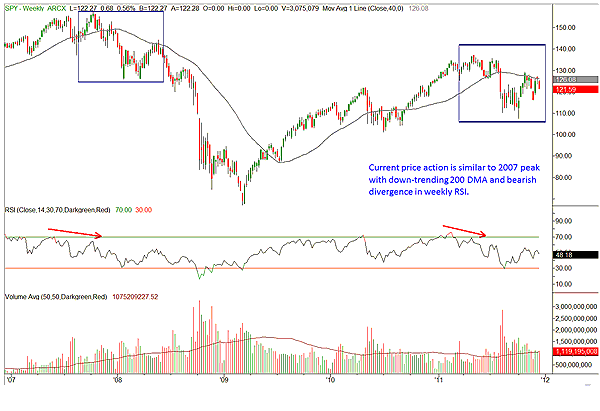
| Let's have a look at a weekly chart of SPY (Figure 1). Fundamentals from the earnings point of view are excellent for Standard & Poor's 500 components. But if you compare the two boxed areas on the chart, they look eerily similar. The left one is from the second half of 2007 when the financial crisis in the US was brewing. SPY made a new high on a falling relative strength index (RSI), and then the 200 DMA rolled over in the early part of 2008. Most of this happened in the seasonally bullish period of December-April. Right now, we are in the same time frame with essentially the same pattern. This time, the backdrop is the eurozone financial crisis. |

|
| FIGURE 1: S&P 500 SPDRs ETF (SPY), WEEKLY. The current downtrending pattern looks similar to the beginning of 2007-08 bear market. |
| Graphic provided by: TradeStation. |
| |
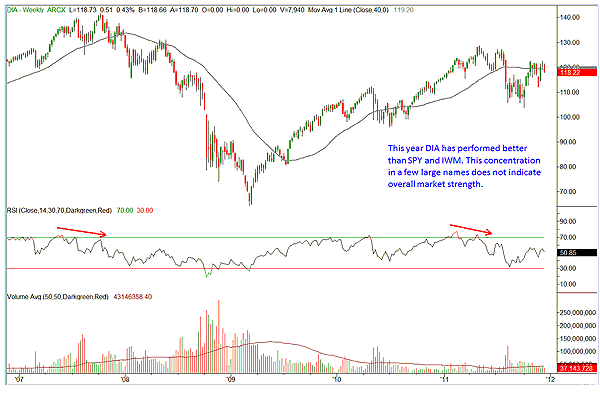
| Now moving to the weekly chart of SPDR Dow Jones Industrial Average ETF (DIA) (Figure 2), we note a flat to downtrending 200 DMA. However, for the week ended December 16, 2011, DIA is still positive for the year. This performance is better than that of SPY and indicates that investors are being cautious and concentrating in a few large-cap names. That's not a bullish sign. |

|
| FIGURE 2: SPDR DOW JONES INDUSTRIAL AVERAGE ETF (DIA), WEEKLY. Itís weakening but not as much as S&P 500. |
| Graphic provided by: TradeStation. |
| |
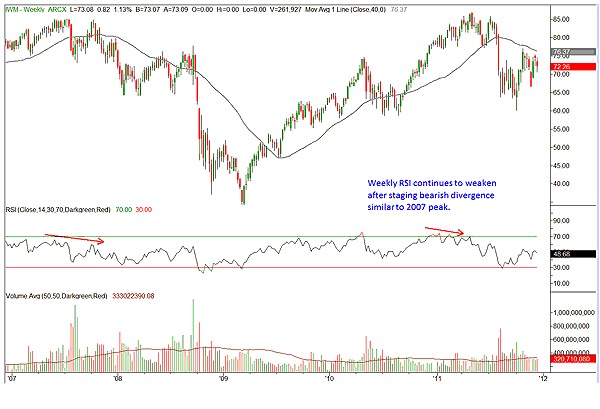
| For further confirmation, let's consider iShares Russell 2000 ETF (IWM) (Figure 3). IWM tracks smaller growth companies, and it shows clear deterioration from its peak in May. It has fallen about 16% since then. In addition, it's down about 7% for the year. If we contrast that with SPY, which is down 3% for the year, and DIA, which is up 2% for the year (as of December 16, 2011), it's evident that growth has been lagging behind large caps. |

|
| FIGURE 3: iSHARES RUSSELL 2000 ETF (IWM), WEEKLY. This ETF of small caps has performed worse than the S&P 500. |
| Graphic provided by: TradeStation. |
| |
| Now, technical indicators and chart patterns reflect the net effect of fundamentals and general macro conditions. Large-cap US multinationals have been doing very well with rising earnings and a swelling cash position. But the macro headwind coming out of the eurozone does not inspire confidence and at times is downright depressing. In this confusing environment, beyond all news and noise, major indexes represented by SPY, IWM, and DIA have unsuccessfully struggled for weeks to claim their 200 DMA, and that in a seasonally strong period. The probability has significantly increased that the market downtrend will continue. |
I am a member of the Market Technicians Association and manage a limited partnership investment club in Virginia. Always seek advice from your own Financial Advisor before acting on any method outlined here since every circumstance is different.
| Address: | 2039 Stone Mill Drive |
| Salem, VA 24153 | |
| Phone # for sales: | 540-330-2911 |
| E-mail address: | ranjanjha@hotmail.com |
Click here for more information about our publications!
Comments
Date:†01/01/12Rank:†4Comment:†great quick macro survey

Request Information From Our Sponsors
- VectorVest, Inc.
- Executive Premier Workshop
- One-Day Options Course
- OptionsPro
- Retirement Income Workshop
- Sure-Fire Trading Systems (VectorVest, Inc.)
- Trading as a Business Workshop
- VectorVest 7 EOD
- VectorVest 7 RealTime/IntraDay
- VectorVest AutoTester
- VectorVest Educational Services
- VectorVest OnLine
- VectorVest Options Analyzer
- VectorVest ProGraphics v6.0
- VectorVest ProTrader 7
- VectorVest RealTime Derby Tool
- VectorVest Simulator
- VectorVest Variator
- VectorVest Watchdog
- StockCharts.com, Inc.
- Candle Patterns
- Candlestick Charting Explained
- Intermarket Technical Analysis
- John Murphy on Chart Analysis
- John Murphy's Chart Pattern Recognition
- John Murphy's Market Message
- MurphyExplainsMarketAnalysis-Intermarket Analysis
- MurphyExplainsMarketAnalysis-Visual Analysis
- StockCharts.com
- Technical Analysis of the Financial Markets
- The Visual Investor
