HOT TOPICS LIST
- MACD
- Fibonacci
- RSI
- Gann
- ADXR
- Stochastics
- Volume
- Triangles
- Futures
- Cycles
- Volatility
- ZIGZAG
- MESA
- Retracement
- Aroon
INDICATORS LIST
LIST OF TOPICS
PRINT THIS ARTICLE
by Koos van der Merwe
Let profits ride and shorten your stops.
Position: Buy
Koos van der Merwe
Has been a technical analyst since 1969, and has worked as a futures and options trader with First Financial Futures in Johannesburg, South Africa.
PRINT THIS ARTICLE
RSI
Taking Profits
12/27/11 11:41:35 AMby Koos van der Merwe
Let profits ride and shorten your stops.
Position: Buy
| We have always been taught that we should allow profits to run, and tighten our stops as the share price rises to heights where the relative strength index (RSI) is at overbought levels. Many traders and investors wait for the RSI, stochastic, or indicator of choice to give them a sell signal, either by a moving average crossing the indicator line, suggesting a sell, or by the indicator rising above and then falling below a horizontal line. RSI is a 70 line, and stochastic an 80 line. However, so many traders are using these lines for sell signals that when you decide to sell, you are joining the multitudes, and the share price falls away fast. Is there another strategy out there that can be considered? |

|
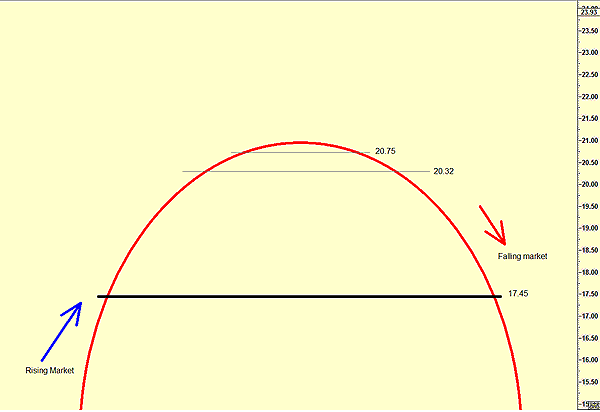
| FIGURE 1: MARKET MOVEMENT |
| Graphic provided by: AdvancedGET. |
| |
| Figure 1 shows you the inverted "U"-shaped rise and fall of a share and suggests that if you sell on a rising market at $17.45, you could miss out on a considerable upside move. On the other hand, if you wait for your stop-loss to trigger at $17.45, you could fill your order with a great deal of downside risk. So the answer is to look for a stop-loss as close to the high as possible, the problem being how high is the high? The two gray horizontal lines on the chart suggest that we should look for a fall in the rising momentum of the share price to estimate a top. Is it better to sell into a rising market, or sell into a falling market? I believe the former. Is there an indicator that can do this? Yes, there is. |

|
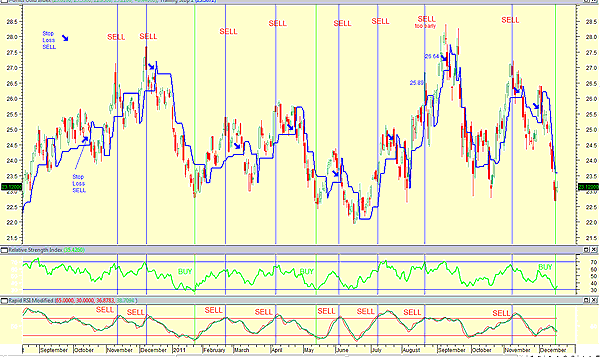
| FIGURE 2: GLD SHOWING SELL SIGNALS GIVEN BY THE RAPID RSI |
| Graphic provided by: MetaStock. |
| |
| In Figure 2, I have chosen to analyze the iUnits Gold Index (GLD). The indicator chosen to give me the sell signals is the rapid RSI modified indicator, with a vertical blue line highlighting a sell. The MetaStock formula is shown below: tp:=14; Plot:=C; change:=ROC(plot,1,$); Z:=Sum(If(change>0,change,0),tp); Y:=Sum(If(change<0,Abs(change),0),tp); Ytemp:=If(y=0,0.0001,y); RS:=Z/Ytemp; 65; 30; RSP:=100-(100/(1+RS)); RSPM:=Mov(RSP,5,S); RSP:=Mov(RSP,3,S); RSP; RSPM I have included a trailing stop-loss indicator for comparison. Note that in every case, the sell signal triggered by the rapid RSI modified indicator has been given on a rising price, much earlier and at a better price than the sell signal given by the trailing stop-loss. Note too that when the trailing stop-loss gave a sell signal, the share price fell dramatically, suggesting that there were many sellers. I have not included volume in the chart to confirm this. In eight sell signals given, only one was given too early. The sell signal given by the rapid RSI was at $25.89, and the sell given had we waited for the stop-loss signal was $26.64, a difference of 75 cents. For buy signals I have chosen the standard 14-period RSI. Taking profits in a rising market is contrary to the maxim of let your profits rise, but here is an indicator that suggests the opposite. |
Has been a technical analyst since 1969, and has worked as a futures and options trader with First Financial Futures in Johannesburg, South Africa.
| Address: | 3256 West 24th Ave |
| Vancouver, BC | |
| Phone # for sales: | 6042634214 |
| E-mail address: | petroosp@gmail.com |
Click here for more information about our publications!
Comments
Date: 12/27/11Rank: Comment: Hope you had a merry Christmas.
Blessings,
Dick Slayton

Request Information From Our Sponsors
- StockCharts.com, Inc.
- Candle Patterns
- Candlestick Charting Explained
- Intermarket Technical Analysis
- John Murphy on Chart Analysis
- John Murphy's Chart Pattern Recognition
- John Murphy's Market Message
- MurphyExplainsMarketAnalysis-Intermarket Analysis
- MurphyExplainsMarketAnalysis-Visual Analysis
- StockCharts.com
- Technical Analysis of the Financial Markets
- The Visual Investor
- VectorVest, Inc.
- Executive Premier Workshop
- One-Day Options Course
- OptionsPro
- Retirement Income Workshop
- Sure-Fire Trading Systems (VectorVest, Inc.)
- Trading as a Business Workshop
- VectorVest 7 EOD
- VectorVest 7 RealTime/IntraDay
- VectorVest AutoTester
- VectorVest Educational Services
- VectorVest OnLine
- VectorVest Options Analyzer
- VectorVest ProGraphics v6.0
- VectorVest ProTrader 7
- VectorVest RealTime Derby Tool
- VectorVest Simulator
- VectorVest Variator
- VectorVest Watchdog
