

HOT TOPICS LIST
- MACD
- Fibonacci
- RSI
- Gann
- ADXR
- Stochastics
- Volume
- Triangles
- Futures
- Cycles
- Volatility
- ZIGZAG
- MESA
- Retracement
- Aroon
INDICATORS LIST
LIST OF TOPICS
PRINT THIS ARTICLE
by Donald W. Pendergast, Jr.
Staying on top of the trend reversals and changes in the markets you follow is of vital importance. Here's a look at a smart way to keep track of them.
Position: N/A
Donald W. Pendergast, Jr.
Donald W. Pendergast is a financial markets consultant who offers specialized services to stock brokers and high net worth individuals who seek a better bottom line for their portfolios.
PRINT THIS ARTICLE
TECHNICAL ANALYSIS
FedEx Bursting Higher From A Range?
12/20/11 02:42:48 PMby Donald W. Pendergast, Jr.
Staying on top of the trend reversals and changes in the markets you follow is of vital importance. Here's a look at a smart way to keep track of them.
Position: N/A
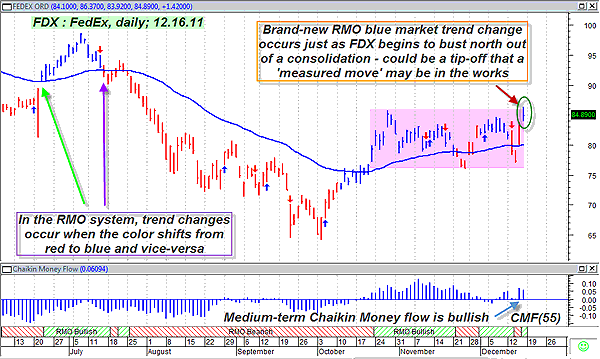
| Two of the coolest subcomponents of the famed RMO (Rahul Mohindar) trading system in MetaStock 11 are the RMO market trend explorations (one for bullish trends and one for bearish trends) found in the explorer feature in the software. These explorations will quickly find all of the stocks (or futures and forex markets) that the RMO system has identified as strongly trending by painting a bullish trend's price bars in blue and a bearish trend's price bars in red. This identification of trend changes don't always occur in conjunction with the actual RMO buy and sell signals on the price chart, and as such, can be used as a standalone market confirmation tool or even as a unique system. I ran the bullish trend change version of this scan on the Standard & Poor's 500 component stocks and found that FedEx's daily chart had a very interesting (and potentially profitable) breakout pattern in the works. Here's a closer look at this fascinating trade setup now (Figure 1). |
|
| FIGURE 1: FDX, DAILY. That's a textbook-quality range breakout chart pattern, if there ever was one. |
| Graphic provided by: MetaStock. |
| Graphic provided by: RMO system indicators from MetaStock 11. |
| |
| FedEx (FDX) has been in business since 1972 and has grown to be one of the all-time giants in the transportation business. If this potentially bullish trade setup follows through, it's also possible that savvy traders can also grow their trading accounts if they can latch on to a powerful continuation move in FDX. Since you've already seen the brand-new blue price bar (circled on the chart), maybe now it's also time to take a gander at the very well-defined consolidation pattern (pink shaded area) that the stock has just begun to bust north out of; look at how the consolidation area appears to be a pause zone that manifested after the stock made a strong rise out of the major low of October 4, 2011. The medium-term money flow (based on the 55-period Chaikin money flow histogram) is still in a bullish way and the relative strength of the stock is also quite good versus the .SPX. Overall, this looks very much like a textbook-quality range breakout trade setup, but as all traders know, sometimes the best-looking setups don't always pan out as expected. Traders wanting to go long may very well want to see the stock pull back on an intraday basis (hopefully finding support from which to continue higher) before committing cash to this particular market. If the stock catches a bid and takes out the high of Friday's setup bar ($86.37), they may wish to put on the remainder of their position -- since the market would at that point be strongly biased toward some sort of a continuation move. But follow-through or not, limiting one's risk to 2% or less on the trade makes good sense, as does the trade management strategy of running a two- to three-bar trailing stop of the daily lows, too. |
| As far as doing a covered call on FDX goes, it would be advisable to use a weekly chart instead of a daily one and wait for some weekly follow-through before implementing a buy-write strategy. Once you see that, then drop back down to the daily chart and consider using something like a 21-period exponential moving average (EMA) or a major uptrend line to use as a trailing stop to manage the position. For now, traders should just focus on wisely engaging the stock-only strategy on the daily chart as shown. The market is always full of opportunity, and using these RMO market trend scans is one way to bring them directly to your attention. Learn to use them to maximum advantage to the benefit of your trading account. |
Donald W. Pendergast is a financial markets consultant who offers specialized services to stock brokers and high net worth individuals who seek a better bottom line for their portfolios.
| Title: | Writer, market consultant |
| Company: | Linear Trading Systems LLC |
| Jacksonville, FL 32217 | |
| Phone # for sales: | 904-239-9564 |
| E-mail address: | lineartradingsys@gmail.com |
Traders' Resource Links | |
| Linear Trading Systems LLC has not added any product or service information to TRADERS' RESOURCE. | |
Click here for more information about our publications!
Comments

Request Information From Our Sponsors
- StockCharts.com, Inc.
- Candle Patterns
- Candlestick Charting Explained
- Intermarket Technical Analysis
- John Murphy on Chart Analysis
- John Murphy's Chart Pattern Recognition
- John Murphy's Market Message
- MurphyExplainsMarketAnalysis-Intermarket Analysis
- MurphyExplainsMarketAnalysis-Visual Analysis
- StockCharts.com
- Technical Analysis of the Financial Markets
- The Visual Investor
- VectorVest, Inc.
- Executive Premier Workshop
- One-Day Options Course
- OptionsPro
- Retirement Income Workshop
- Sure-Fire Trading Systems (VectorVest, Inc.)
- Trading as a Business Workshop
- VectorVest 7 EOD
- VectorVest 7 RealTime/IntraDay
- VectorVest AutoTester
- VectorVest Educational Services
- VectorVest OnLine
- VectorVest Options Analyzer
- VectorVest ProGraphics v6.0
- VectorVest ProTrader 7
- VectorVest RealTime Derby Tool
- VectorVest Simulator
- VectorVest Variator
- VectorVest Watchdog