HOT TOPICS LIST
- MACD
- Fibonacci
- RSI
- Gann
- ADXR
- Stochastics
- Volume
- Triangles
- Futures
- Cycles
- Volatility
- ZIGZAG
- MESA
- Retracement
- Aroon
INDICATORS LIST
LIST OF TOPICS
PRINT THIS ARTICLE
by Chaitali Mohile
Will LOPE recover or plunge to its previous low?
Position: N/A
Chaitali Mohile
Active trader in the Indian stock markets since 2003 and a full-time writer. Trading is largely based upon technical analysis.
PRINT THIS ARTICLE
TECHNICAL ANALYSIS
Will LOPE Recover?
12/21/11 07:41:40 AMby Chaitali Mohile
Will LOPE recover or plunge to its previous low?
Position: N/A
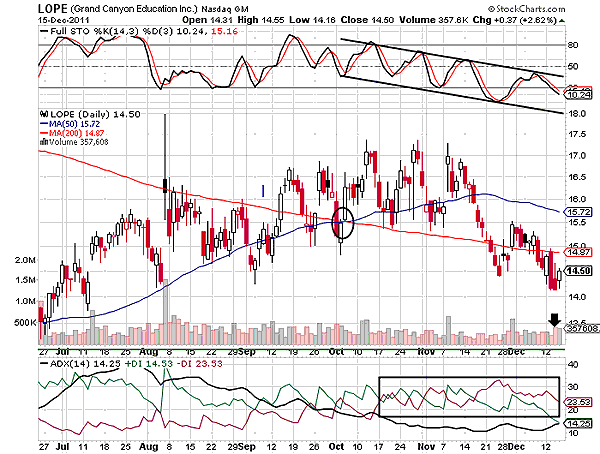
| Grand Canyon Education (LOPE), a volatile stock, was unable to sustain its various supports (Figure 1). The two moving averages crossed each other, indicating a bullish crossover on the price chart (see the black circle). A bullish rally, which started from $13, is filled with equal buying and selling pressures. The red and white candles, with large upper-lower shadows, are reflecting high volatility and instability in the rally. As a result, LOPE failed to establish support at a 50-day moving average as well as a 200-day moving average (MA). The declining price rally in Figure 1 looks like a rounded top. Can we consider this pattern to be a bearish reversal? |

|
| FIGURE 1: LOPE, DAILY. Due to the declining stochastic oscillator, the stock is likely to challenge the previous support at $13. |
| Graphic provided by: StockCharts.com. |
| |
| Generally, the rounded-top formation appears at the top of the bullish rally, suggesting a termination of the existing advance move. The pattern breaks downward, opening a fresh bearish rally. In Figure 1, an overheated uptrend reversed, affecting the bullish rally. Later, the declining average directional index (ADX) (14) slipped below 20 levels with tangled positive (green line) and negative (red line) formations, suggesting a weak trend. The full stochastic (14,3,3) has formed a descending channel, highlighting diminishing momentum. Currently, the oscillator is approaching the lower trendline of the channel, indicating a small room for the ongoing bearish rally. |
| Thus, LOPE is likely to plunge toward its previous low, completing the rounded-top formation. The long-term chart will clarify the significance of a rounded top. |

|
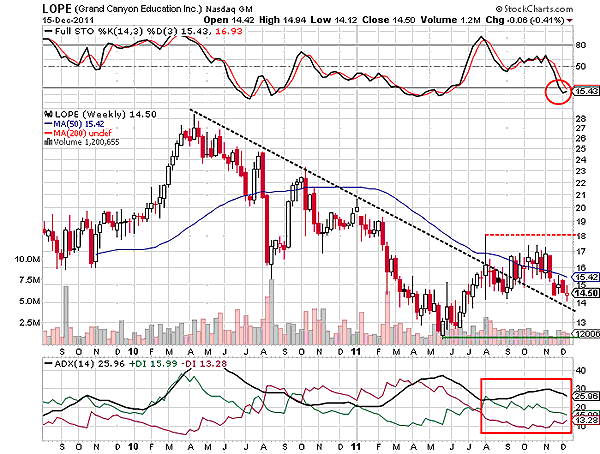
| FIGURE 2: LOPE, WEEKLY. The current bearish rally of LOPE is likely to establish support at the descending trendline and would turn range-bound. |
| Graphic provided by: StockCharts.com. |
| |
| The weekly chart in Figure 2 shows that LOPE has been declining since 2010. A fresh downtrend was developed by the corrective rally in mid-2010. Since the stock was already in a downtrend, we cannot consider the rounded-top pattern as a bearish reversal, which is also visible on the weekly time frame chart in Figure 2. Although the dome-shaped bearish rally at the bottom of the price chart looks like a rounded-top pattern, it is not the bearish reversal. LOPE has support at $13. A bearish breakdown of this support would worsen the bearish conditions of LOPE. The descending trendline marked by joining the lower highs of the corrective rally extends immediate support to the rally. |
| The stochastic oscillator in Figure 2 is likely to surge above the oversold levels, indicating an upcoming relief rally. The ADX (14) is showing a developing uptrend. Therefore, LOPE is likely to initiate a bullish move with the trendline support. The red dotted line in Figure 2 is the resistance for the forthcoming rally. Thus, LOPE is likely to remain range-bound between the trendline support and candlestick resistance line (red dotted). Due to the trendline support, the stock would not hit the previous low support. If in a worst-case scenario the stock retraces towards 13 levels, the price rally would face serious damage. To conclude, LOPE would not recover completely but move range-bound between the trendline support and upper shadow resistance. |
Active trader in the Indian stock markets since 2003 and a full-time writer. Trading is largely based upon technical analysis.
| Company: | Independent |
| Address: | C1/3 Parth Indraprasth Towers. Vastrapur |
| Ahmedabad, Guj 380015 | |
| E-mail address: | chaitalimohile@yahoo.co.in |
Traders' Resource Links | |
| Independent has not added any product or service information to TRADERS' RESOURCE. | |
Click here for more information about our publications!
PRINT THIS ARTICLE

Request Information From Our Sponsors
- StockCharts.com, Inc.
- Candle Patterns
- Candlestick Charting Explained
- Intermarket Technical Analysis
- John Murphy on Chart Analysis
- John Murphy's Chart Pattern Recognition
- John Murphy's Market Message
- MurphyExplainsMarketAnalysis-Intermarket Analysis
- MurphyExplainsMarketAnalysis-Visual Analysis
- StockCharts.com
- Technical Analysis of the Financial Markets
- The Visual Investor
- VectorVest, Inc.
- Executive Premier Workshop
- One-Day Options Course
- OptionsPro
- Retirement Income Workshop
- Sure-Fire Trading Systems (VectorVest, Inc.)
- Trading as a Business Workshop
- VectorVest 7 EOD
- VectorVest 7 RealTime/IntraDay
- VectorVest AutoTester
- VectorVest Educational Services
- VectorVest OnLine
- VectorVest Options Analyzer
- VectorVest ProGraphics v6.0
- VectorVest ProTrader 7
- VectorVest RealTime Derby Tool
- VectorVest Simulator
- VectorVest Variator
- VectorVest Watchdog
