HOT TOPICS LIST
- MACD
- Fibonacci
- RSI
- Gann
- ADXR
- Stochastics
- Volume
- Triangles
- Futures
- Cycles
- Volatility
- ZIGZAG
- MESA
- Retracement
- Aroon
INDICATORS LIST
LIST OF TOPICS
PRINT THIS ARTICLE
by Koos van der Merwe
Times are tough. Money is tight. Does this mean that stores like Walmart will do better this holiday season as shoppers fill those Christmas stockings with cheaper merchandise?
Position: Sell
Koos van der Merwe
Has been a technical analyst since 1969, and has worked as a futures and options trader with First Financial Futures in Johannesburg, South Africa.
PRINT THIS ARTICLE
MOVING AVERAGES
Going For Walmart
12/15/11 03:26:31 PMby Koos van der Merwe
Times are tough. Money is tight. Does this mean that stores like Walmart will do better this holiday season as shoppers fill those Christmas stockings with cheaper merchandise?
Position: Sell
| With the economy flirting with a recession, with problems in Europe influencing the movement of the US stock market, with the average worker counting his pennies carefully, and with the unemployed coming through the festive season with far less to spend than in previous years, it would be logical for stores like Walmart to attract more shoppers. |

|
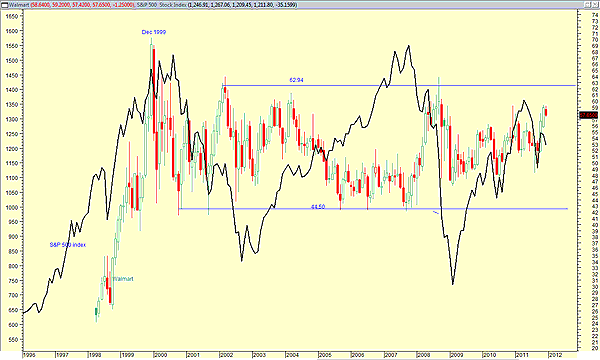
| FIGURE 1: WALMART MONTHLY WITH THE S&P 500 INDEX |
| Graphic provided by: MetaStock. |
| |
| Figure 1 is a monthly chart of Walmart and shows the movement of the stock as compared to the Standard & Poor's 500. Do note, however, that in December 1999, the share price reached a new high and fell into January 2000 ahead of the autumn in the S&P 500. The share price of Walmart started recovering in mid-2000 as the S&P 500 continued falling. The share price fell to the $44.50 level by October 2000 and traded in the range of $44.50 to $62.94 from that date on. The share price would fall to a lower level of that trading range as the S&P 500 rose, and it would rise to the upper level of the range as the S&P 500 fell. At the moment, even though the S&P is rising as shown on the chart, the share price of Walmart looks to be drifting upward ever so slightly. |

|
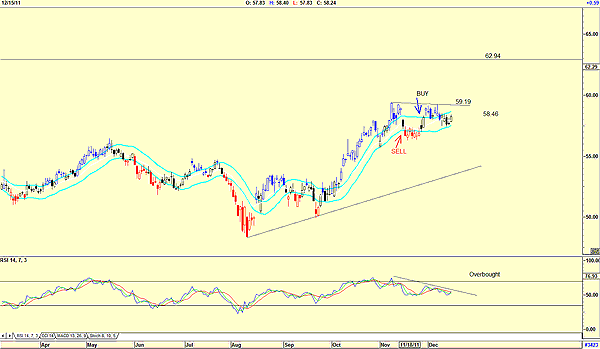
| FIGURE 2: WALMART, DAILY |
| Graphic provided by: AdvancedGET. |
| |
| Looking at the daily chart, in Figure 2, we can see that Walmart is tracing a sideways trend since November 2011. The resistance level as shown on the chart is $59.19. Note as well that the share price gave a buy signal by moving above the upper band of the JM internal band indicator. In this instance, the JM internal band is a 15-period simple moving average offset by 1% positive and 1% negative. The price has tested the lower band but did not break below it, so it did not give a sell signal. With the relative strength index (RSI) having tested overbought levels and moving downward after a sell signal, we have to wonder whether it is worth taking the gamble of buying the share price, should it break above the resistance line at $59.19 with an expected target of $62.94, the long-term resistance line. Personally, I would leave Walmart alone for now. |
Has been a technical analyst since 1969, and has worked as a futures and options trader with First Financial Futures in Johannesburg, South Africa.
| Address: | 3256 West 24th Ave |
| Vancouver, BC | |
| Phone # for sales: | 6042634214 |
| E-mail address: | petroosp@gmail.com |
Click here for more information about our publications!
PRINT THIS ARTICLE

Request Information From Our Sponsors
- StockCharts.com, Inc.
- Candle Patterns
- Candlestick Charting Explained
- Intermarket Technical Analysis
- John Murphy on Chart Analysis
- John Murphy's Chart Pattern Recognition
- John Murphy's Market Message
- MurphyExplainsMarketAnalysis-Intermarket Analysis
- MurphyExplainsMarketAnalysis-Visual Analysis
- StockCharts.com
- Technical Analysis of the Financial Markets
- The Visual Investor
- VectorVest, Inc.
- Executive Premier Workshop
- One-Day Options Course
- OptionsPro
- Retirement Income Workshop
- Sure-Fire Trading Systems (VectorVest, Inc.)
- Trading as a Business Workshop
- VectorVest 7 EOD
- VectorVest 7 RealTime/IntraDay
- VectorVest AutoTester
- VectorVest Educational Services
- VectorVest OnLine
- VectorVest Options Analyzer
- VectorVest ProGraphics v6.0
- VectorVest ProTrader 7
- VectorVest RealTime Derby Tool
- VectorVest Simulator
- VectorVest Variator
- VectorVest Watchdog
