HOT TOPICS LIST
- MACD
- Fibonacci
- RSI
- Gann
- ADXR
- Stochastics
- Volume
- Triangles
- Futures
- Cycles
- Volatility
- ZIGZAG
- MESA
- Retracement
- Aroon
INDICATORS LIST
LIST OF TOPICS
PRINT THIS ARTICLE
by Chaitali Mohile
The bullish rally of the technology select sector has slipped into a long-term consolidation period.
Position: N/A
Chaitali Mohile
Active trader in the Indian stock markets since 2003 and a full-time writer. Trading is largely based upon technical analysis.
PRINT THIS ARTICLE
CONSOLID FORMATION
XLK Stuck At Resistance
12/19/11 11:08:36 AMby Chaitali Mohile
The bullish rally of the technology select sector has slipped into a long-term consolidation period.
Position: N/A
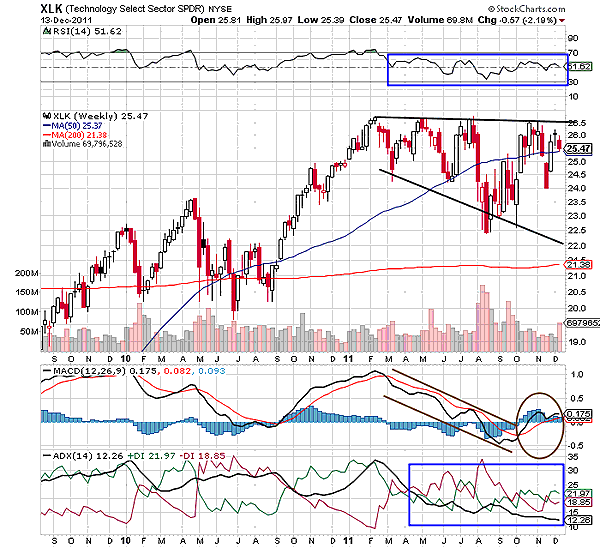
| The Technology Select Sector SPDR (XLK) began a bullish rally in 2010 with the support of the 200-day moving average (MA) on its weekly time frame in Figure 1. The 50-day moving average (MA) breached the long-term MA (200-day) resistance and surged along with the price rally. Both technical actions can generate bullish sentiments. The index surged to $22 in early 2011. However, the relative strength index (RSI) was reluctant to establish support at 70 levels, indicating a weakness in the rally. After losing its bullish strength, the indicator turned highly volatile in between 30 and 60 levels. As a result, the price rally entered a sideways consolidation in March 2011. Initially, XLK sustained above the 50-day MA, but the increasing volatility pulled down the prices. The index struggled near the support-resistance zone of the short-term MA. |

|
| FIGURE 1: XLK, WEEKLY. The lower lows have expanded the lower consolidation range of XLK. |
| Graphic provided by: StockCharts.com. |
| |
| An upper consolidation range was flat at $26.50; however, the lower range was diverging. The upcoming bearish strength and the existing volatility formed lower lows on the weekly chart. The moving average convergence/divergence (MACD) (12,26,9) in Figure 1 formed a descending channel. Due to the lower lows and lower highs, MACD oscillator marginally slipped into negative territory below the zero line, highlighting weak momentum. The selling pressure increased as soon as a developed uptrend declined. The big picture resulted in long-term bullish consolidation for XLK. The index has been consolidating for almost a year. Since the lower trading range is widening, traders are at high risk. |
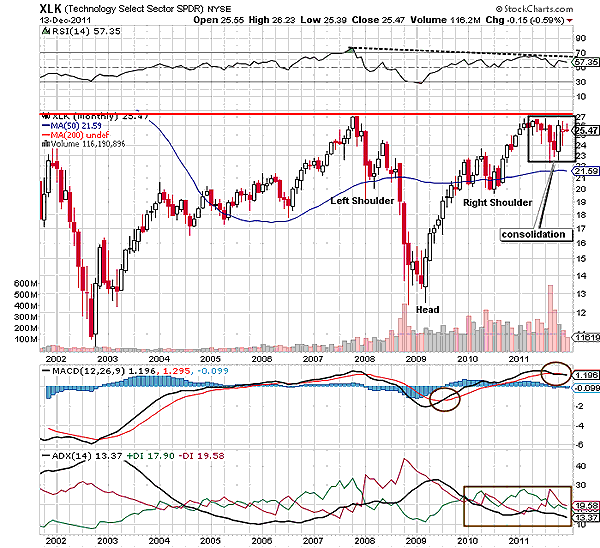
| According to the monthly time frame chart of Figure 2, $26.50 is the historical high of 2008. The corrective rally in 2008-09 and a pullback rally in 2009-10 formed a long-term inverted head & shoulder pattern (Figure 2). Technically, this pattern should have broken upward. The pattern fails if the rally turns sideways immediately before or after a breakout. Therefore, the inverted head & shoulders formation in Figure 1 has failed. The previous high resistance had robust bearish pressure to suppress the pattern breakout, resulting in consolidation. |

|
| FIGURE 2: XLK, MONTHLY. The all-time high formed in 2008 discouraged the bullish breakout of an inverted head & shoulder. |
| Graphic provided by: StockCharts.com. |
| |
| The RSI (14) formed a lower high below 70, the MACD (12,26,9) turned negative in positive territory, and the average directional index (ADX) (14) descended below the 15 levels. In this scenario, XLK would continue its horizontal price action for another few months. The selling pressure and buying pressure are equal; therefore, the trend indicator would not develop in either direction. In addition, there is lack of bullish momentum as well as strength in XLK. Hence, a bullish breakout cannot be anticipated for the next few months. |
| The monthly chart helped us to understand the reason of consolidation at the previous high. Most of the sector indexes are undergoing similar bearish phases. XLK would require technical as well as economical support to convert the previous high resistance to support. |
Active trader in the Indian stock markets since 2003 and a full-time writer. Trading is largely based upon technical analysis.
| Company: | Independent |
| Address: | C1/3 Parth Indraprasth Towers. Vastrapur |
| Ahmedabad, Guj 380015 | |
| E-mail address: | chaitalimohile@yahoo.co.in |
Traders' Resource Links | |
| Independent has not added any product or service information to TRADERS' RESOURCE. | |
Click here for more information about our publications!
PRINT THIS ARTICLE

|

Request Information From Our Sponsors
- VectorVest, Inc.
- Executive Premier Workshop
- One-Day Options Course
- OptionsPro
- Retirement Income Workshop
- Sure-Fire Trading Systems (VectorVest, Inc.)
- Trading as a Business Workshop
- VectorVest 7 EOD
- VectorVest 7 RealTime/IntraDay
- VectorVest AutoTester
- VectorVest Educational Services
- VectorVest OnLine
- VectorVest Options Analyzer
- VectorVest ProGraphics v6.0
- VectorVest ProTrader 7
- VectorVest RealTime Derby Tool
- VectorVest Simulator
- VectorVest Variator
- VectorVest Watchdog
- StockCharts.com, Inc.
- Candle Patterns
- Candlestick Charting Explained
- Intermarket Technical Analysis
- John Murphy on Chart Analysis
- John Murphy's Chart Pattern Recognition
- John Murphy's Market Message
- MurphyExplainsMarketAnalysis-Intermarket Analysis
- MurphyExplainsMarketAnalysis-Visual Analysis
- StockCharts.com
- Technical Analysis of the Financial Markets
- The Visual Investor
