HOT TOPICS LIST
- MACD
- Fibonacci
- RSI
- Gann
- ADXR
- Stochastics
- Volume
- Triangles
- Futures
- Cycles
- Volatility
- ZIGZAG
- MESA
- Retracement
- Aroon
INDICATORS LIST
LIST OF TOPICS
PRINT THIS ARTICLE
by Donald W. Pendergast, Jr.
This stock had been consolidating for six weeks until December 13. Will this latest bullish breakout attempt soon drive the stock back into the $30 range again?
Position: Buy
Donald W. Pendergast, Jr.
Donald W. Pendergast is a financial markets consultant who offers specialized services to stock brokers and high net worth individuals who seek a better bottom line for their portfolios.
PRINT THIS ARTICLE
TRADING SYSTEMS
With Urban Outfitters, A Pop Due Before Christmas?
12/14/11 12:05:29 PMby Donald W. Pendergast, Jr.
This stock had been consolidating for six weeks until December 13. Will this latest bullish breakout attempt soon drive the stock back into the $30 range again?
Position: Buy
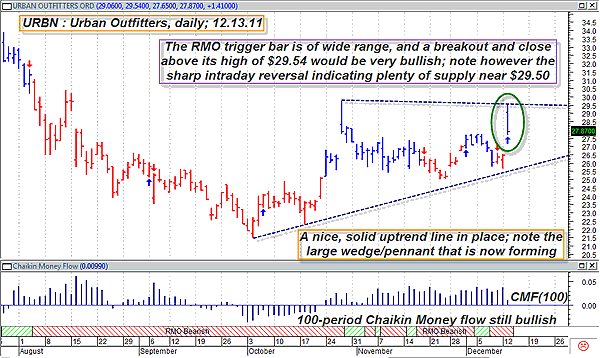
| It's tough to time a breakout (in either diirection) from a tight consolidation range. In most cases, it pays to let the stock decide to go its own way, successfully completing a breakout attempt before trying to jump on board. Shares of Urban Outfitters (URBN) have seemingly made a major move in quest of a successful upward breakout with the latest RMO (Rahul Mohindar) trading system's swing buy signal. Here's a closer look now (Figure 1). |

|
| FIGURE 1: URBN, DAILY. Trading breakout setups can be tough; always have a definite strategy for how to scale in and then exit such trades at a decent profit, all while limiting your risk. |
| Graphic provided by: MetaStock. |
| Graphic provided by: RMO system indicators from MetaStock 11. |
| |
| The daily chart of URBN looks attractive if you are of the bullish persuasion. The long-term Chaikin money flow (CMF)(100) histogram is still in the bullish camp (on the upside of its zero line), even as the stock just burst north out of a six-week long consolidation pattern that saw the issue ranging back and forth between $25 and $28 per share during much of November and part of December. Now, with the fresh RMO swing buy signal, URBN appears to be tipping its hand, looking as if it's getting ready for another assault on the $30 price barrier again. Glancing at the chart, you can see where the stock shot up toward $30 in late October 2011, just before it dropped into the beginning of the range bound pattern it just emerged from. A large pennant/wedge pattern is also forming; the very strong uptrend line serves as the lower boundary, while the two spike highs serve as ad hoc resistances for the upper channel line for the pattern. Adding bullish fuel to this setup is the strong relative strength of URBN versus the .SPX over the past 13 weeks -- it's outperforming the index by a notable degree. |
| Trading breakouts can be a little tricky, especially when the stock has had such a sharp one-day move, but one way to limit your risk if you trade this setup is to either: A. Scale into your position in thirds, perhaps part of it on at a price just above Tuesday's high, another third at 15 cents above that and then the final third maybe 10 cents above that. In this way, you're only putting on a full position if the stock demonstrates some ability and desire to follow through on the initial surge that you already see on the chart. Then there's plan B-- B. Wait for a minor intraday pullback in the next morning session before jumping on board with half a position and then once again wait for a rise above Tuesday's high of $29.54 before putting on the remainder. And always use a stop-loss, preferably a few ticks below the trigger bar's low of $27.65. The year-end rally that many expected never really did materialize, so be extra wise when initiating positions in this chaotic phase in market history. |
Donald W. Pendergast is a financial markets consultant who offers specialized services to stock brokers and high net worth individuals who seek a better bottom line for their portfolios.
| Title: | Writer, market consultant |
| Company: | Linear Trading Systems LLC |
| Jacksonville, FL 32217 | |
| Phone # for sales: | 904-239-9564 |
| E-mail address: | lineartradingsys@gmail.com |
Traders' Resource Links | |
| Linear Trading Systems LLC has not added any product or service information to TRADERS' RESOURCE. | |
Click here for more information about our publications!
PRINT THIS ARTICLE

Request Information From Our Sponsors
- StockCharts.com, Inc.
- Candle Patterns
- Candlestick Charting Explained
- Intermarket Technical Analysis
- John Murphy on Chart Analysis
- John Murphy's Chart Pattern Recognition
- John Murphy's Market Message
- MurphyExplainsMarketAnalysis-Intermarket Analysis
- MurphyExplainsMarketAnalysis-Visual Analysis
- StockCharts.com
- Technical Analysis of the Financial Markets
- The Visual Investor
- VectorVest, Inc.
- Executive Premier Workshop
- One-Day Options Course
- OptionsPro
- Retirement Income Workshop
- Sure-Fire Trading Systems (VectorVest, Inc.)
- Trading as a Business Workshop
- VectorVest 7 EOD
- VectorVest 7 RealTime/IntraDay
- VectorVest AutoTester
- VectorVest Educational Services
- VectorVest OnLine
- VectorVest Options Analyzer
- VectorVest ProGraphics v6.0
- VectorVest ProTrader 7
- VectorVest RealTime Derby Tool
- VectorVest Simulator
- VectorVest Variator
- VectorVest Watchdog
