HOT TOPICS LIST
- MACD
- Fibonacci
- RSI
- Gann
- ADXR
- Stochastics
- Volume
- Triangles
- Futures
- Cycles
- Volatility
- ZIGZAG
- MESA
- Retracement
- Aroon
INDICATORS LIST
LIST OF TOPICS
PRINT THIS ARTICLE
by Koos van der Merwe
An analyst interviewed on CNBC looked at NIKE ahead of the Olympic Games. Here's what he had to say.
Position: Accumulate
Koos van der Merwe
Has been a technical analyst since 1969, and has worked as a futures and options trader with First Financial Futures in Johannesburg, South Africa.
PRINT THIS ARTICLE
PERFORMANCE IND
Nike And The Olympics
12/13/11 09:39:33 AMby Koos van der Merwe
An analyst interviewed on CNBC looked at NIKE ahead of the Olympic Games. Here's what he had to say.
Position: Accumulate
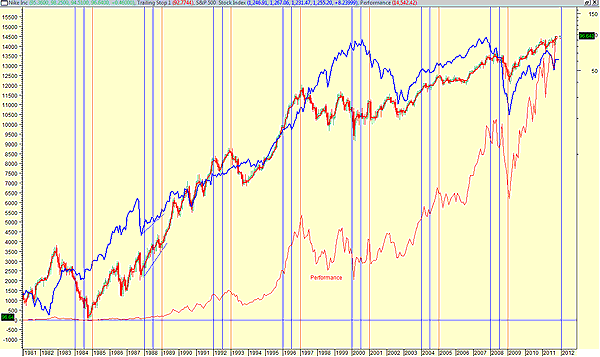
| Without mentioning any names, the analyst stated that he had looked at the performance of NIKE relative to the S&P 500 index before the Olympic Games starting from 1998. That in the months before the games, Nike always outperformed the S&P 500 index. With the 2012 Olymic games on the horizon, I decided to check out what he said. |

|
| FIGURE 1: NIKE AND THE S&P 500 WITH PERFORMANCE LINE |
| Graphic provided by: MetaStock. |
| |
| Figure 1 shows Nike (candlestick chart relative to the Standard & Poor's 500 index (line chart)) from 1981. Both are in semi-log scale, with the scale for NIKE on the right, and the scale for the S&P 500 on the left. The vertical lines show the first six months of each Olympic year. Note the following: a. A performance line of Nike relative to the S&P 500, in red. b. In 1984, Nike fell during the first six months, as did the S&P 500. However, the index started recovering, while Nike continued falling. c. In 1988, both Nike and the S&P 500 rose, with Nike rising faster than the index. The angle of the support line on each shows this. d. In the first six months of 1992, the chart shows that NIKE fell while the index rose. In the second six months of 1992, the price of NIKE rose faster than that of the index. e. In 1996, Nike outperformed the index in the first six months, with the index moving sharply up only in the second half of the year. f. In the year 2000, the S&P 500 rose ever so slightly, while Nike moved sideways. Then the index fell sharply, while the price of NIKE rose. g. In the first six months of 2004, both Nike and the S&P 500 moved sideways, and both rose equally in the second half of the year. h. In 2008, the S&P 500 fell sharply in the first six months while Nike moved sideways, only falling in the second six months of the year, but not as fast as the S&P 500. There is no doubt that the share price of Nike does outperform the S&P 500 in the Olympic year, but this does not mean to say that Nike is always a good investment in the Olympic year. In 1984, 2000, and 2008, although the share price performed better than the index, the share price actually fell. Keeping this in mind, I would be a buyer of Nike as we enter 2012, but I would keep my stops under close watch. |
Has been a technical analyst since 1969, and has worked as a futures and options trader with First Financial Futures in Johannesburg, South Africa.
| Address: | 3256 West 24th Ave |
| Vancouver, BC | |
| Phone # for sales: | 6042634214 |
| E-mail address: | petroosp@gmail.com |
Click here for more information about our publications!
PRINT THIS ARTICLE

Request Information From Our Sponsors
- StockCharts.com, Inc.
- Candle Patterns
- Candlestick Charting Explained
- Intermarket Technical Analysis
- John Murphy on Chart Analysis
- John Murphy's Chart Pattern Recognition
- John Murphy's Market Message
- MurphyExplainsMarketAnalysis-Intermarket Analysis
- MurphyExplainsMarketAnalysis-Visual Analysis
- StockCharts.com
- Technical Analysis of the Financial Markets
- The Visual Investor
- VectorVest, Inc.
- Executive Premier Workshop
- One-Day Options Course
- OptionsPro
- Retirement Income Workshop
- Sure-Fire Trading Systems (VectorVest, Inc.)
- Trading as a Business Workshop
- VectorVest 7 EOD
- VectorVest 7 RealTime/IntraDay
- VectorVest AutoTester
- VectorVest Educational Services
- VectorVest OnLine
- VectorVest Options Analyzer
- VectorVest ProGraphics v6.0
- VectorVest ProTrader 7
- VectorVest RealTime Derby Tool
- VectorVest Simulator
- VectorVest Variator
- VectorVest Watchdog
