HOT TOPICS LIST
- MACD
- Fibonacci
- RSI
- Gann
- ADXR
- Stochastics
- Volume
- Triangles
- Futures
- Cycles
- Volatility
- ZIGZAG
- MESA
- Retracement
- Aroon
INDICATORS LIST
LIST OF TOPICS
PRINT THIS ARTICLE
by Mike Carr, CMT
The Nikkei 225 index has been in a bear market since 1989, but there have been a number of trading opportunities.
Position: Buy
Mike Carr, CMT
Mike Carr, CMT, is a member of the Market Technicians Association, and editor of the MTA's newsletter, Technically Speaking. He is also the author of "Smarter Investing in Any Economy: The Definitive Guide to Relative Strength Investing," and "Conquering the Divide: How to Use Economic Indicators to Catch Stock Market Trends."
PRINT THIS ARTICLE
RATE OF CHANGE
Japanese Stock Market At Tradable Low
12/13/11 09:27:41 AMby Mike Carr, CMT
The Nikkei 225 index has been in a bear market since 1989, but there have been a number of trading opportunities.
Position: Buy
| Bear markets are always assumed to end, and many individual investors still believe that long-term buy & hold strategies are destined for success. Experience in Japan tests both theories. The bear market there has lasted for almost 23 years, and the Nikkei 225 Index is still almost 80% below its highs. While it hasn't been profitable for buy & hold investors, there have been trading opportunities in the market. Using both daily and weekly data, the moving average convergence/divergence (MACD) has provided profitable signals. Shorts have been very profitable, as one would expect given the longer trend. The current market shows that shorts should be covered and aggressive traders should even be long. This is not a long-term forecast, since no one knows when the ultimate bottom will be reached. |
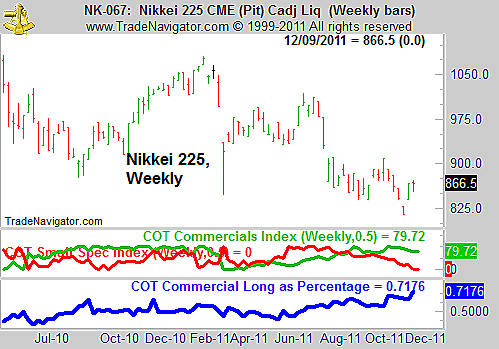
| Sentiment, using COT data, is bullish. Raw COT data can be converted to an index using the stochastic formula, a technique taught by trader Larry Williams. In doing so (Figure 1), it can be seen that commercials are very bullish and small speculators are bearish. This is often the setup for a long trade. In addition, Williams has written about looking at commercial positions as a percent of the open interest. While this is certainly an imperfect market for this technique since the Nikkei can be traded on a number of nonreporting exchanges, this indicator is also bullish. |

|
| FIGURE 1: NIKKEI, WEEKLY. Commercials hold an unusually large amount of the open interest in the Nikkei contract. |
| Graphic provided by: Trade Navigator. |
| |
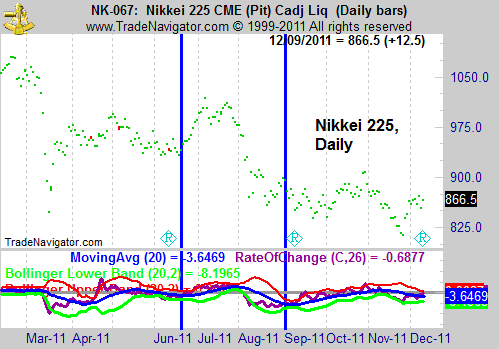
| Rate of change confirms that the latest decline is most likely over for now (Figure 2). This indicator has recently crossed above its moving average, a sign that a downtrend has run its course in the past. Traders should not be short and should even consider a long trade. Monitoring the MACD for a short trade is also a possible trading strategy. |

|
| FIGURE 2: NIKKEI, DAILY Daily ROC shows that at least a short-term bottom is probably in place. |
| Graphic provided by: Trade Navigator. |
| |
| Long-term trends offer multiple trading opportunities, and that has been true in the Nikkei while it has moved relentlessly lower. |
Mike Carr, CMT, is a member of the Market Technicians Association, and editor of the MTA's newsletter, Technically Speaking. He is also the author of "Smarter Investing in Any Economy: The Definitive Guide to Relative Strength Investing," and "Conquering the Divide: How to Use Economic Indicators to Catch Stock Market Trends."
| Website: | www.moneynews.com/blogs/MichaelCarr/id-73 |
| E-mail address: | marketstrategist@gmail.com |
Click here for more information about our publications!
PRINT THIS ARTICLE

Request Information From Our Sponsors
- StockCharts.com, Inc.
- Candle Patterns
- Candlestick Charting Explained
- Intermarket Technical Analysis
- John Murphy on Chart Analysis
- John Murphy's Chart Pattern Recognition
- John Murphy's Market Message
- MurphyExplainsMarketAnalysis-Intermarket Analysis
- MurphyExplainsMarketAnalysis-Visual Analysis
- StockCharts.com
- Technical Analysis of the Financial Markets
- The Visual Investor
- VectorVest, Inc.
- Executive Premier Workshop
- One-Day Options Course
- OptionsPro
- Retirement Income Workshop
- Sure-Fire Trading Systems (VectorVest, Inc.)
- Trading as a Business Workshop
- VectorVest 7 EOD
- VectorVest 7 RealTime/IntraDay
- VectorVest AutoTester
- VectorVest Educational Services
- VectorVest OnLine
- VectorVest Options Analyzer
- VectorVest ProGraphics v6.0
- VectorVest ProTrader 7
- VectorVest RealTime Derby Tool
- VectorVest Simulator
- VectorVest Variator
- VectorVest Watchdog
