HOT TOPICS LIST
- MACD
- Fibonacci
- RSI
- Gann
- ADXR
- Stochastics
- Volume
- Triangles
- Futures
- Cycles
- Volatility
- ZIGZAG
- MESA
- Retracement
- Aroon
INDICATORS LIST
LIST OF TOPICS
PRINT THIS ARTICLE
by Chaitali Mohile
The breakout and support-resistances levels make Staar Surgical a strong candidate for your watchlist.
Position: Buy
Chaitali Mohile
Active trader in the Indian stock markets since 2003 and a full-time writer. Trading is largely based upon technical analysis.
PRINT THIS ARTICLE
BREAKOUTS
Staar Surgical Shows A Buy Signal
12/13/11 01:03:57 PMby Chaitali Mohile
The breakout and support-resistances levels make Staar Surgical a strong candidate for your watchlist.
Position: Buy
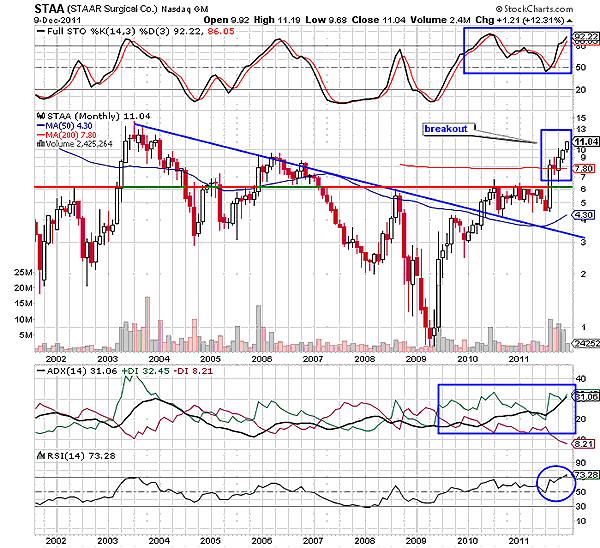
| Selecting stocks for a low-risk long position is a tricky task in volatile market conditions. Stocks with a fresh bullish breakout and strong support usually offer good buying opportunities for traders and investors. Staar Surgical (STAA) can be one such example. On the monthly chart in Figure 1, STAA has recently breached the 200-day moving average (MA) resistance and has sustained above this newly formed support. The bullish breakout has nearly three technical support levels that can protect the stock by undergoing a serious correction. Any stock that sustains above or breaks through the long-term MA resistance is considered to be a strong stock. STAA has supports at 200-day MA, the support-resistance line, the 50-day moving average, and the descending trendline in Figure 1. |
| The support-resistance line is marked to highlight the various supports formed by the previous highs. Earlier, these highs were the strong resistance for the pullback rallies. We can see that the relief rally initiated in 2009 moved sideways near the previous high resistance levels. Eventually, in August 2011 one single strong bullish candle breached the resistance line as well as the 200-day MA resistance. The breakout witnessed a huge surge in volume, confirming the stability of the fresh rally. Although bullish candles of the current breakout rally have small lower and upper shadows, each candle is closing at a new high. This suggests bullish strength in the rally. In addition, the range-bound relative strength index (RSI) (14) is likely to shift above the 70 level after a long span of seven years. However, a confirmed signal is highly essential. |

|
| FIGURE 1: STAA, MONTHLY |
| Graphic provided by: StockCharts.com. |
| |
| The average directional index (ADX) (14) is reflecting a developing uptrend. If the trend indicator sustains above 30 levels, the bullish trend would get developed. An overbought full stochastic (14,3,3) is reflecting a bullish momentum in the rally. Since the oscillator was unable to surge above 90 levels in previous years, STAA is likely to slow down. The momentum oscillator would plunge a few points to create room for the rally. Therefore, the support levels would not be breached. Traders and investors should consider these points while trading STAA or a stock with similar technical details. STAA can top the watchlist, and traders can stay long with the target of previous high ($15). Fresh traders can initiate long trades with low volume. |
| To conclude, the buy signal of STAA can be considered for trading. The technical details mentioned here could help guide you in selecting stocks in the future. |
Active trader in the Indian stock markets since 2003 and a full-time writer. Trading is largely based upon technical analysis.
| Company: | Independent |
| Address: | C1/3 Parth Indraprasth Towers. Vastrapur |
| Ahmedabad, Guj 380015 | |
| E-mail address: | chaitalimohile@yahoo.co.in |
Traders' Resource Links | |
| Independent has not added any product or service information to TRADERS' RESOURCE. | |
Click here for more information about our publications!
PRINT THIS ARTICLE

Request Information From Our Sponsors
- StockCharts.com, Inc.
- Candle Patterns
- Candlestick Charting Explained
- Intermarket Technical Analysis
- John Murphy on Chart Analysis
- John Murphy's Chart Pattern Recognition
- John Murphy's Market Message
- MurphyExplainsMarketAnalysis-Intermarket Analysis
- MurphyExplainsMarketAnalysis-Visual Analysis
- StockCharts.com
- Technical Analysis of the Financial Markets
- The Visual Investor
- VectorVest, Inc.
- Executive Premier Workshop
- One-Day Options Course
- OptionsPro
- Retirement Income Workshop
- Sure-Fire Trading Systems (VectorVest, Inc.)
- Trading as a Business Workshop
- VectorVest 7 EOD
- VectorVest 7 RealTime/IntraDay
- VectorVest AutoTester
- VectorVest Educational Services
- VectorVest OnLine
- VectorVest Options Analyzer
- VectorVest ProGraphics v6.0
- VectorVest ProTrader 7
- VectorVest RealTime Derby Tool
- VectorVest Simulator
- VectorVest Variator
- VectorVest Watchdog
