HOT TOPICS LIST
- MACD
- Fibonacci
- RSI
- Gann
- ADXR
- Stochastics
- Volume
- Triangles
- Futures
- Cycles
- Volatility
- ZIGZAG
- MESA
- Retracement
- Aroon
INDICATORS LIST
LIST OF TOPICS
PRINT THIS ARTICLE
by David Penn
When a nation's currency leads, that nation's equities have few alternatives but to follow.
Position: N/A
David Penn
Technical Writer for Technical Analysis of STOCKS & COMMODITIES magazine, Working-Money.com, and Traders.com Advantage.
PRINT THIS ARTICLE
TECHNICAL ANALYSIS
Currencies and Equities
05/13/02 11:05:53 AMby David Penn
When a nation's currency leads, that nation's equities have few alternatives but to follow.
Position: N/A
| The relationship between a nation's currency and its equity markets has been established for some time. Hedge fund managers such as Mark Boucher include a global currency RS (relative strength) analysis in their international country screening. John Murphy, in his classic text, Intermarket Technical Analysis, suggests "a rising dollar will eventually push inflation and interest rates lower, which is bullish for stocks. A falling dollar will eventually push stock prices lower because of the rise in inflation and interest rates. However, it is an oversimplification to say that a rising dollar is always bullish for stocks, and a falling dollar is always bearish for equities." But this issue of "oversimplification" may not be quite the obstacle it seems. Murphy later notes that "the lead times between the peaks and troughs in the three markets (currency, bonds, stocks) can often span several months to as long as two years. An understanding of this sequence explains why a falling dollar can coexist with a rising bond and stock market for a period of time." |
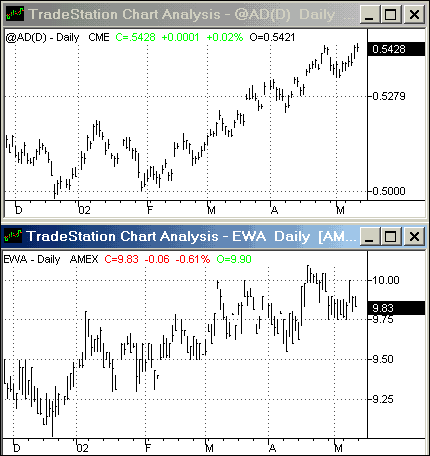
| This suggests that one helpful way of determining whether or not a country's stock market will continue to advance is to check on the strength of that country's currency. Because of the inflationary effects of a falling national currency, stocks will eventually succumb to the inevitably rising interest rates that accompany virtually all inflation-fighting strategies. Conversely, as American investors learned in the early 1980s, a strong dollar freed from chronic devaluation through inflation, is a mighty engine for economic growth and financial opportunity. In the examples presented here, we can see how the Australian dollar and Mexican peso have led the stock markets of their respective countries in 2002. The proxy for the Australian stock market will be the MSCI ishare EWA. Note how both the Australian dollar (known colloquially as the "Aussie") and the EWA moved up from bottoms in the fall of 2001. Although the Aussie did not move up in earnest until the February 2002 bottom (a bottom that represented a test of the mid-December 2001 low), the Australian dollar did eventually explode up from its bottom, rocketing from 0.500 to 0.542 (about $4,200 per contract) in less than three months. The Aussie, in fact, did not make a lower low of any kind until the beginning of May. As of this writing, the Aussie was headed toward a test of its April 2002/YTD high just north of 0.544. |

|
| Figure 1: The Australian dollar leads Australian stocks upward. |
| Graphic provided by: TradeStation. |
| |
| At the same time, the EWA has also been moving up. The EWA, as the chart shows, moved much faster off its bottom than did the Aussie initially, though the January declines in the Aussie did occasion declines in the EWA. The EWA spiked to just above 9.75 at the beginning of 2002, as did the Aussie, and both declined sharply shortly thereafter. However the successful test of the December 2001 bottom in the Aussie also served as a bottom for the declining EWA. |
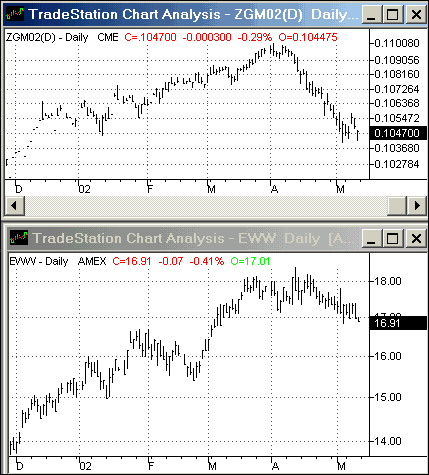
What is important now, as the EWA is up 6.7% for the year and up 13.7% from its October 2001 low, is what the Aussie might be suggesting about its own advance and, by implication, the six-month rally in the EWA. In this case, a successful test of the April 2002 highs in the Australian dollar would be among the best signs that the EWA rally might continue. But should the current upmove in the Aussie stall out or decline, or should the current correction in the EWA fall through the six-month trendline, then, as Murphy put it, "the clock (will have) begun ticking on the bull markets." Figure 2: Once the bull market in the peso began to decline in earnest, Mexican stocks slumped. Another example of the currency/equity relationship comes from looking at the relationship between the Mexican peso and the Mexican stock market. Again, the stock market proxy will be an ishare, in this case, Mexico's EWW. Here, we see a similar pattern to the Australian dollar/EWA- at least initially. Both the peso and the EWW put in significant bottoms in mid-September 2001 and moved up strongly: the peso peaked in March 2002 after a climb of 1216 points (approximately $6,080 per contract) from the September bottom, and the EWW rose 50% before topping out in April 2002. |
| But in April, while the EWW was topping, the peso was already tossing in the towel. Over the month of April, the EWW dropped about 5%. The Mexican peso, however, fell 422 points, a loss of almost 35%. Although the peso has begun to find some support at 0.104576 (after the 35% decline), EWW longs might want to watch to see if nearby support at 17 holds or is broken. The implications from the falling peso are, at this point, bearish for Mexican stocks (and bonds for that matter). But because of the lag times Murphy mentioned above, the falling peso should be more of a warning to potential weakness in Mexican equities, rather than an automatic "sell signal" on Mexican stocks. |
Technical Writer for Technical Analysis of STOCKS & COMMODITIES magazine, Working-Money.com, and Traders.com Advantage.
| Title: | Technical Writer |
| Company: | Technical Analysis, Inc. |
| Address: | 4757 California Avenue SW |
| Seattle, WA 98116 | |
| Phone # for sales: | 206 938 0570 |
| Fax: | 206 938 1307 |
| Website: | www.Traders.com |
| E-mail address: | DPenn@traders.com |
Traders' Resource Links | |
| Charting the Stock Market: The Wyckoff Method -- Books | |
| Working-Money.com -- Online Trading Services | |
| Traders.com Advantage -- Online Trading Services | |
| Technical Analysis of Stocks & Commodities -- Publications and Newsletters | |
| Working Money, at Working-Money.com -- Publications and Newsletters | |
| Traders.com Advantage -- Publications and Newsletters | |
| Professional Traders Starter Kit -- Software | |
Click here for more information about our publications!
Comments
Date: 05/14/02Rank: 5Comment:

Request Information From Our Sponsors
- StockCharts.com, Inc.
- Candle Patterns
- Candlestick Charting Explained
- Intermarket Technical Analysis
- John Murphy on Chart Analysis
- John Murphy's Chart Pattern Recognition
- John Murphy's Market Message
- MurphyExplainsMarketAnalysis-Intermarket Analysis
- MurphyExplainsMarketAnalysis-Visual Analysis
- StockCharts.com
- Technical Analysis of the Financial Markets
- The Visual Investor
- VectorVest, Inc.
- Executive Premier Workshop
- One-Day Options Course
- OptionsPro
- Retirement Income Workshop
- Sure-Fire Trading Systems (VectorVest, Inc.)
- Trading as a Business Workshop
- VectorVest 7 EOD
- VectorVest 7 RealTime/IntraDay
- VectorVest AutoTester
- VectorVest Educational Services
- VectorVest OnLine
- VectorVest Options Analyzer
- VectorVest ProGraphics v6.0
- VectorVest ProTrader 7
- VectorVest RealTime Derby Tool
- VectorVest Simulator
- VectorVest Variator
- VectorVest Watchdog
