

HOT TOPICS LIST
- MACD
- Fibonacci
- RSI
- Gann
- ADXR
- Stochastics
- Volume
- Triangles
- Futures
- Cycles
- Volatility
- ZIGZAG
- MESA
- Retracement
- Aroon
INDICATORS LIST
LIST OF TOPICS
PRINT THIS ARTICLE
by Koos van der Merwe
There are many programs out there that analyze the stock market. When they eventually justify what you believe, you feel relieved.
Position: Accumulate
Koos van der Merwe
Has been a technical analyst since 1969, and has worked as a futures and options trader with First Financial Futures in Johannesburg, South Africa.
PRINT THIS ARTICLE
ELLIOTT WAVE
Whatever The Final Outcome, The DJIA Looks Positive
12/12/11 12:10:10 PMby Koos van der Merwe
There are many programs out there that analyze the stock market. When they eventually justify what you believe, you feel relieved.
Position: Accumulate
| For the past year, my Elliott wave charts have been telling me that the market is not in a recession, but in a correction that will move positive. With market bears looking for any reason to justify their beliefs, we can start doubting our charts. When all of a sudden, however, a program that automatically prepares an Elliott wave count agrees with your forecast, you can wipe the sweat from your brow, breathe a sigh of relief, and shout "Bravo!" |
|
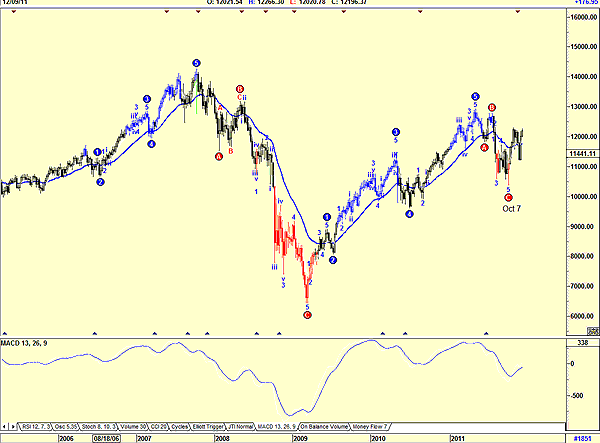
| FIGURE 1: DJIA, WEEKLY, WITH ELLIOTT WAVE COUNT |
| Graphic provided by: AdvancedGET. |
| |
| Figure 1 is a weekly chart of the Dow Jones Industrial Average (DJIA). The weekly chart suggests that the DJIA bottomed on October 7 and is now in a new bull phase. This is confirmed by the moving average convergence/divergence (MACD) indicator, which has completed a wave C and is now moving up. The chart follows the first rule of Elliott wave theory: the wave count must look correct. |
|
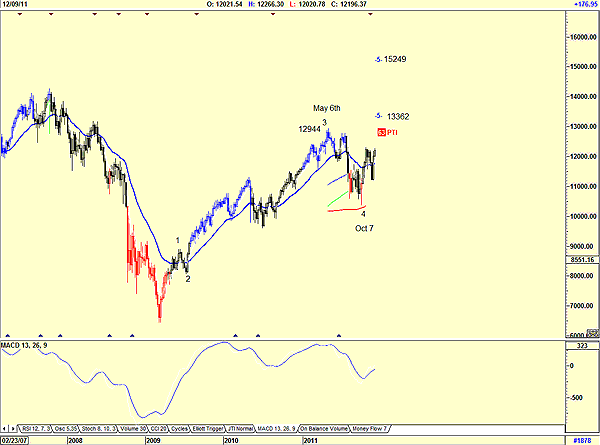
| FIGURE 2: DJIA, WEEKLY, WITH PROJECTED WAVE COUNT |
| Graphic provided by: AdvancedGET. |
| |
| Figure 2 shows the two possible projections of wave 5 with a 63% probability (PTI). The chart suggests that the new bull trend should top out at either 13362 (conservative) or 15249 (hopeful). However, this is on a varying count to Figure 1, and the chart's wave count does not look correct, but the two targets could be kept in mind, nonetheless. A move by the DJIA above the high of 12944 of May 6 will confirm a possible move to these two targets. Whatever the final outcome, the DJIA does look positive. The economic drama in Europe, and the political play in the US, both of which are bearish, look like they may be slowly fading. Outlook for the economic future does indeed look bullish. |
Has been a technical analyst since 1969, and has worked as a futures and options trader with First Financial Futures in Johannesburg, South Africa.
| Address: | 3256 West 24th Ave |
| Vancouver, BC | |
| Phone # for sales: | 6042634214 |
| E-mail address: | petroosp@gmail.com |
Click here for more information about our publications!
Comments
Date:�12/13/11Rank:�5Comment:�Koos...Merry Christmas.
Thanks for your insights this past year.
Dick Slayton

Request Information From Our Sponsors
- VectorVest, Inc.
- Executive Premier Workshop
- One-Day Options Course
- OptionsPro
- Retirement Income Workshop
- Sure-Fire Trading Systems (VectorVest, Inc.)
- Trading as a Business Workshop
- VectorVest 7 EOD
- VectorVest 7 RealTime/IntraDay
- VectorVest AutoTester
- VectorVest Educational Services
- VectorVest OnLine
- VectorVest Options Analyzer
- VectorVest ProGraphics v6.0
- VectorVest ProTrader 7
- VectorVest RealTime Derby Tool
- VectorVest Simulator
- VectorVest Variator
- VectorVest Watchdog
- StockCharts.com, Inc.
- Candle Patterns
- Candlestick Charting Explained
- Intermarket Technical Analysis
- John Murphy on Chart Analysis
- John Murphy's Chart Pattern Recognition
- John Murphy's Market Message
- MurphyExplainsMarketAnalysis-Intermarket Analysis
- MurphyExplainsMarketAnalysis-Visual Analysis
- StockCharts.com
- Technical Analysis of the Financial Markets
- The Visual Investor