HOT TOPICS LIST
- MACD
- Fibonacci
- RSI
- Gann
- ADXR
- Stochastics
- Volume
- Triangles
- Futures
- Cycles
- Volatility
- ZIGZAG
- MESA
- Retracement
- Aroon
INDICATORS LIST
LIST OF TOPICS
PRINT THIS ARTICLE
by Billy Williams
In a market correction, finding stocks that hold their first-stage base patterns and finding stocks that are constantly resetting theirs can be the difference between a winning trade and a losing one.
Position: N/A
Billy Williams
Billy Williams has been trading the markets for 27 years, specializing in momentum trading with stocks and options.
PRINT THIS ARTICLE
TECHNICAL INDICATORS
Spotting First-Stage Base Patterns
12/12/11 09:16:59 AMby Billy Williams
In a market correction, finding stocks that hold their first-stage base patterns and finding stocks that are constantly resetting theirs can be the difference between a winning trade and a losing one.
Position: N/A
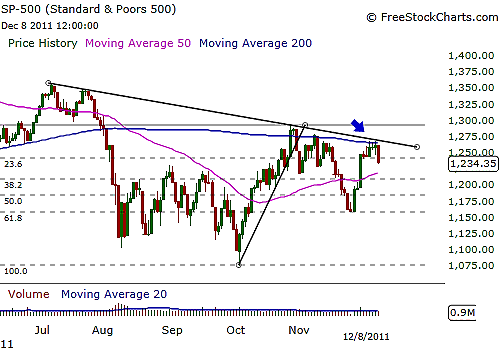
| The Standard & Poor's 500 (SPX) is still struggling on low volume, indicating a lack of conviction on the part of investors to enter the market that does not bolster hopes of a rally anytime soon. Worse, since October 27, 2011, price has touched the 200-day simple moving average (SMA) three times and each time has been rejected and forced downward. This reveals that a downsloping 200 SMA is exhibiting strong resistance to any bullish price action as well as dissuading buyers from taking control of the trend. A short-term bull run from the 0.618 Fibonacci retracement from the November 25, 2011, low offered some hope that the market would rally higher, but a retracement from Fib level typically fails to meet its former high, which in this case was set on October 27, 2011. However, price could pull back before challenging that high and if accompanied on higher trade volume, it could push past the resistance level that is currently set at the 200-day SMA. See Figure 1. |

|
| FIGURE 1: SPX. The SPX has touched the 200-day SMA three times since October 27, 2011, rejecting price and forcing it downward and revealing a high level of overhead resistance. |
| Graphic provided by: www.freestockcharts.com. |
| |
| This is still risky territory to buy stocks since stocks tend to move in tandem with the overall market, which is still in a correction that is only made worse by the lack of volume. That said, traders are at a crossroads and must sit on the sidelines with the patience of a sniper who is waiting with alert awareness for the target to appear, which could result from the European Union announcing a debt plan or any measure to get a hold of its debt problems. |
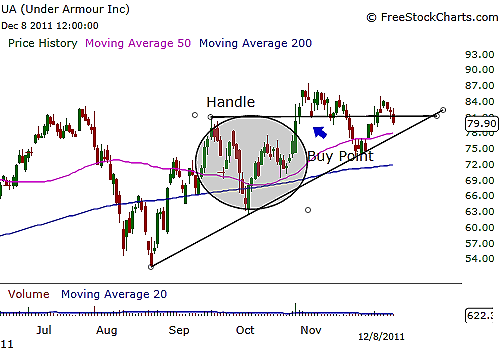
| If the best happens and enthusiasm is renewed for equities before the end of the year, you must look to buy stock that has held up well in the current depressed market conditions. The difference can be significant when choosing between a good stock and a bad stock, and one of the biggest indicators is whether a stock has maintained its first-stage base during the correction or just goes on to create new base patterns, one after the other. For example, strongly performing stocks like Under Armor Inc. (UA) have performed well in the past and, even now, have experienced increasing levels of ownership by institutional investors, such as Fidelity Contra Fund and others, for four consecutive quarters and has also formed a first-stage base in its price action from July. See Figure 2. |

|
| FIGURE 2: UA. A buy entry was signaled in UA from a cup & handle pattern on October 25, 2011, but in the current market correction has been unable to rally. In fact, it is resetting its first-stage price base and indicates that it is unlikely to emerge as a stock leader once the market finds its bottom. |
| Graphic provided by: www.freestockcharts.com. |
| |
| UA had signaled a buy entry on October 25, 2011, at the $80.80 mark but failed to follow through and rack up a 20% gain over the next several weeks, as typified by a breakout. Since then, the stock has floundered back and forth, and while remaining within 2% of its buy point on either side of the entry, this lack of upward price movement is, sadly, all too common in a market correction or under the control of the bears. Currently, UA is showing signs of creating another base pattern under current market conditions. This is an example of a good stock that cannot realize its full potential for the trader or investor due to a lack of movement in the overall market. And in reality, other strongly performing stocks that have held near their highs during a market correction are more likely to take the market higher, while the so-so stocks will often languish despite their strong fundamentals. |
| This is why it is important to identify stocks that have been able to maintain their price bases without resetting them over and over again as they have maintained their high relative strength and are likely to emerge as the next stock leaders, leading the overall market to new highs and, hopefully, break through the 200-day SMA and begin a new bull run. |
Billy Williams has been trading the markets for 27 years, specializing in momentum trading with stocks and options.
| Company: | StockOptionSystem.com |
| E-mail address: | stockoptionsystem.com@gmail.com |
Traders' Resource Links | |
| StockOptionSystem.com has not added any product or service information to TRADERS' RESOURCE. | |
Click here for more information about our publications!
PRINT THIS ARTICLE

|

Request Information From Our Sponsors
- VectorVest, Inc.
- Executive Premier Workshop
- One-Day Options Course
- OptionsPro
- Retirement Income Workshop
- Sure-Fire Trading Systems (VectorVest, Inc.)
- Trading as a Business Workshop
- VectorVest 7 EOD
- VectorVest 7 RealTime/IntraDay
- VectorVest AutoTester
- VectorVest Educational Services
- VectorVest OnLine
- VectorVest Options Analyzer
- VectorVest ProGraphics v6.0
- VectorVest ProTrader 7
- VectorVest RealTime Derby Tool
- VectorVest Simulator
- VectorVest Variator
- VectorVest Watchdog
- StockCharts.com, Inc.
- Candle Patterns
- Candlestick Charting Explained
- Intermarket Technical Analysis
- John Murphy on Chart Analysis
- John Murphy's Chart Pattern Recognition
- John Murphy's Market Message
- MurphyExplainsMarketAnalysis-Intermarket Analysis
- MurphyExplainsMarketAnalysis-Visual Analysis
- StockCharts.com
- Technical Analysis of the Financial Markets
- The Visual Investor
