HOT TOPICS LIST
- MACD
- Fibonacci
- RSI
- Gann
- ADXR
- Stochastics
- Volume
- Triangles
- Futures
- Cycles
- Volatility
- ZIGZAG
- MESA
- Retracement
- Aroon
INDICATORS LIST
LIST OF TOPICS
PRINT THIS ARTICLE
by Mike Carr, CMT
Traders should always consider multiple time frames in developing their market opinion.
Position: Buy
Mike Carr, CMT
Mike Carr, CMT, is a member of the Market Technicians Association, and editor of the MTA's newsletter, Technically Speaking. He is also the author of "Smarter Investing in Any Economy: The Definitive Guide to Relative Strength Investing," and "Conquering the Divide: How to Use Economic Indicators to Catch Stock Market Trends."
PRINT THIS ARTICLE
RATE OF CHANGE
Multiple Time Frame Analysis Makes A Bullish Case For S&P 500
12/09/11 09:33:59 AMby Mike Carr, CMT
Traders should always consider multiple time frames in developing their market opinion.
Position: Buy
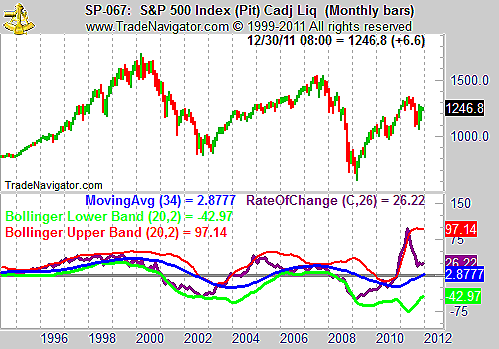
| On a monthly basis, the Standard & Poor's 500 reached an overbought extreme earlier this year (Figure 1). The 26-month rate of change (ROC) broke well above its upper Bollinger Band, an event indicating that the gains were in the top 2.5% of market action. On a monthly time frame, this type of bullish behavior is unsustainable and is likely to reverse. The index fell about 20% after the ROC fell back below the upper band. |

|
| FIGURE 1: S&P 500, MONTHLY. The ROC shows an overbought condition as the market peaked. |
| Graphic provided by: Trade Navigator. |
| |
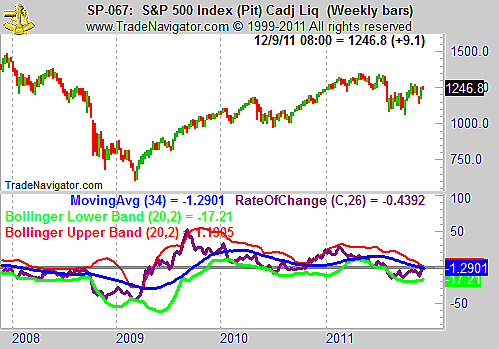
| The weekly chart (Figure 2) shows that the ROC should be interpreted differently in this time frame. When the indicator approaches the upper band, it is more likely to be a signal of the start of a trend than an end. Markets do trend for extended periods of time. The monthly time frame would be expected to show the price trends, and the ROC would confirm exhaustion of powerful price moves in that time frame. The weekly chart would show the ROC leading price rather than lagging, as it does on the larger time frame. |

|
| FIGURE 2: S&P 500, WEEKLY. The ROC breaking above the upper band on the weekly chart tends to signal further gains. |
| Graphic provided by: Trade Navigator. |
| |
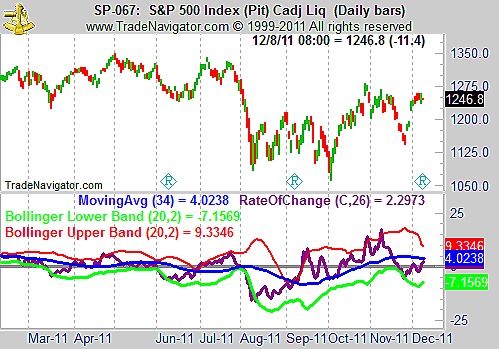
| The daily chart (Figure 3) shows the near randomness of daily market action. The ROC swings between overbought and oversold and signals, generated by applying Bollinger Bands to the indicator, showing mixed success. |

|
| FIGURE 3: S&P 500, DAILY. The daily chart is supportive of a bullish breakout. |
| Graphic provided by: Trade Navigator. |
| |
| What the ROC does show on the daily chart is that the indicator is far from overbought. That supports the bullish argument for the S&P 500, since the indicator does seem to move from lower to upper band quite often. A level of 1320 on the S&P 500 would be in line with the behavior of the ROC indicator. |
Mike Carr, CMT, is a member of the Market Technicians Association, and editor of the MTA's newsletter, Technically Speaking. He is also the author of "Smarter Investing in Any Economy: The Definitive Guide to Relative Strength Investing," and "Conquering the Divide: How to Use Economic Indicators to Catch Stock Market Trends."
| Website: | www.moneynews.com/blogs/MichaelCarr/id-73 |
| E-mail address: | marketstrategist@gmail.com |
Click here for more information about our publications!
Comments
Date: 12/09/11Rank: 1Comment:

|

Request Information From Our Sponsors
- StockCharts.com, Inc.
- Candle Patterns
- Candlestick Charting Explained
- Intermarket Technical Analysis
- John Murphy on Chart Analysis
- John Murphy's Chart Pattern Recognition
- John Murphy's Market Message
- MurphyExplainsMarketAnalysis-Intermarket Analysis
- MurphyExplainsMarketAnalysis-Visual Analysis
- StockCharts.com
- Technical Analysis of the Financial Markets
- The Visual Investor
- VectorVest, Inc.
- Executive Premier Workshop
- One-Day Options Course
- OptionsPro
- Retirement Income Workshop
- Sure-Fire Trading Systems (VectorVest, Inc.)
- Trading as a Business Workshop
- VectorVest 7 EOD
- VectorVest 7 RealTime/IntraDay
- VectorVest AutoTester
- VectorVest Educational Services
- VectorVest OnLine
- VectorVest Options Analyzer
- VectorVest ProGraphics v6.0
- VectorVest ProTrader 7
- VectorVest RealTime Derby Tool
- VectorVest Simulator
- VectorVest Variator
- VectorVest Watchdog
