

HOT TOPICS LIST
- MACD
- Fibonacci
- RSI
- Gann
- ADXR
- Stochastics
- Volume
- Triangles
- Futures
- Cycles
- Volatility
- ZIGZAG
- MESA
- Retracement
- Aroon
INDICATORS LIST
LIST OF TOPICS
PRINT THIS ARTICLE
by Chaitali Mohile
The long-term symmetrical triangle is increasing the volatility of Spain ishares.
Position: N/A
Chaitali Mohile
Active trader in the Indian stock markets since 2003 and a full-time writer. Trading is largely based upon technical analysis.
PRINT THIS ARTICLE
SYMMETRICAL TRIANGLE
EWP In Dense Volatility Cloud
12/09/11 01:55:56 PMby Chaitali Mohile
The long-term symmetrical triangle is increasing the volatility of Spain ishares.
Position: N/A
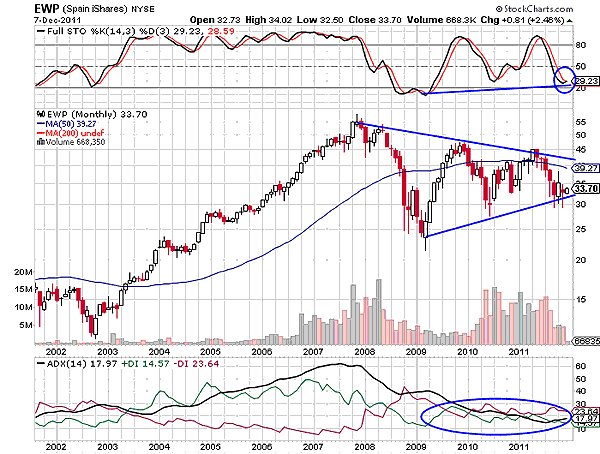
| Among the triangles -- ascending, descending, and symmetrical -- the breakout direction of the third triangle is not fixed. A symmetrical triangle is much different than the other two. This triangle is formed by the converging seller's and buyer's line. Spain ishares (EWP) is forming the symmetrical triangle on the monthly time frame chart you see in Figure 1. This long-term chart makes the formation highly reliable. The bullish story of EWP ended in late 2007 as the price indicated a top formation at 56 levels. |
| A highly overbought full stochastic (14,3,3) suggested a robust reversal rally under way. An uptrend was overheated as well. Hence, EWP was on the edge to initiate a fresh bearish rally in 2008. Thereafter, EWP began forming a series of lower highs and higher lows. The upper declining trendline is the seller's line and the lower ascending trendline is the buyer's line. The symmetrical triangle also looks like the flag of a flag & pennant continuation pattern. |
|
| FIGURE 1: EWP, MONTHLY |
| Graphic provided by: StockCharts.com. |
| |
| In Figure 1, the symmetrical triangle is formed during price consolidation. Therefore, the triangle can also be considered as the bullish consolidation. But the triangle has been constructed in the past two years. Hence, I would treat the converging formation as a symmetrical triangle. The trading range has narrowed, but the triangle has not reached its maturity point. Technically, a breakout occurs when the two converging trendlines of the symmetrical triangle joint at one single point. Currently, the price is ready to surge toward the upper trendline with the support of the lower trendline. The stochastic oscillator is oversold, indicating a small bullish rally. However, this narrow trading range (33 and 40) would yield a high risk for all types of traders. We can think of taking quick profits between the two ranges. But as the trendlines converge further, the volatility would increase, and the trades are likely to get trapped. |
| The current economical condition of Spain is engulfed with high volatility. The symmetrical triangle on EWP would worsen the technical conditions as well. Since the breakout direction of this triangle is uncertain, traders have to wait for the strong breakout signals. EWP would continue its narrow range-bound rally till the price breaches either of the trendlines. This is likely to increase the pressure on sellers as well on buyers. The average directional index (ADX) (14) has plunged below 15 levels with tangled positive directional index (+DI) and negative directional index (-DI), suggesting volatile consolidation for EWP. |
| To conclude, the narrowing range would pour high volatility in EWP. |
Active trader in the Indian stock markets since 2003 and a full-time writer. Trading is largely based upon technical analysis.
| Company: | Independent |
| Address: | C1/3 Parth Indraprasth Towers. Vastrapur |
| Ahmedabad, Guj 380015 | |
| E-mail address: | chaitalimohile@yahoo.co.in |
Traders' Resource Links | |
| Independent has not added any product or service information to TRADERS' RESOURCE. | |
Click here for more information about our publications!
PRINT THIS ARTICLE

Request Information From Our Sponsors
- StockCharts.com, Inc.
- Candle Patterns
- Candlestick Charting Explained
- Intermarket Technical Analysis
- John Murphy on Chart Analysis
- John Murphy's Chart Pattern Recognition
- John Murphy's Market Message
- MurphyExplainsMarketAnalysis-Intermarket Analysis
- MurphyExplainsMarketAnalysis-Visual Analysis
- StockCharts.com
- Technical Analysis of the Financial Markets
- The Visual Investor
- VectorVest, Inc.
- Executive Premier Workshop
- One-Day Options Course
- OptionsPro
- Retirement Income Workshop
- Sure-Fire Trading Systems (VectorVest, Inc.)
- Trading as a Business Workshop
- VectorVest 7 EOD
- VectorVest 7 RealTime/IntraDay
- VectorVest AutoTester
- VectorVest Educational Services
- VectorVest OnLine
- VectorVest Options Analyzer
- VectorVest ProGraphics v6.0
- VectorVest ProTrader 7
- VectorVest RealTime Derby Tool
- VectorVest Simulator
- VectorVest Variator
- VectorVest Watchdog