HOT TOPICS LIST
- MACD
- Fibonacci
- RSI
- Gann
- ADXR
- Stochastics
- Volume
- Triangles
- Futures
- Cycles
- Volatility
- ZIGZAG
- MESA
- Retracement
- Aroon
INDICATORS LIST
LIST OF TOPICS
PRINT THIS ARTICLE
by Gary Grosschadl
Broadening tops are a bearish formation and the Dow has two it may be working on-- A large long term one with scary implications and a smaller one contained within.
Position: N/A
Gary Grosschadl
Independent Canadian equities trader and technical analyst based in Peterborough
Ontario, Canada.
PRINT THIS ARTICLE
BROADENING FORMATION
The Dow's Bearish Broadening Formations Persist
05/13/02 11:11:52 AMby Gary Grosschadl
Broadening tops are a bearish formation and the Dow has two it may be working on-- A large long term one with scary implications and a smaller one contained within.
Position: N/A
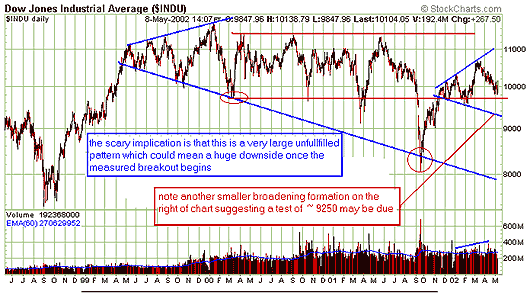
| The broadening top formation has a series of higher highs and lower lows and is considered fulfilled when it breaks to the downside, outside of the lower trendline. Because it is such a wide-reaching pattern, a mere touch or test of the lower trendline has substantial implications even without a downside break. Should a downside break occur, the height of the pattern subtracted from the downside breakout point gives you the approximate target. |
| Looking at the smaller broadening pattern we can surmise two downside scenarios should the bears rule: 1. A test of the lower trendline around 9250 and a bounce up. 2. Failure at the trendline possibly leading to fulfillment of the pattern at around 8200. Note that with extra bearishness it could come down to test the bigger lower trendline which would have sub-8000 implications. The only good news in all of this is that if history repeats, this lower trendline touch could be a great entry signal for the bulls as in the past trendline touches. In this way the failure of the pattern to fulfill becomes it's own bullish trading signal. We really don't want to get into the downside scenario should the downside touch fail and the fullfilment of the much larger broadening pattern come into play. Besides markets tend to be reversal oriented and by that point the markets would be extremely oversold. We'll cross that bridge when it comes. |

|
| Graphic provided by: stockcharts.com. |
| |
| The volume considerations for the broadening pattern call for an expansion in volume as new highs are hit. This can be seen in the Dow chart. |
Independent Canadian equities trader and technical analyst based in Peterborough
Ontario, Canada.
| Website: | www.whatsonsale.ca/financial.html |
| E-mail address: | gwg7@sympatico.ca |
Click here for more information about our publications!
Comments
Date: 05/13/02Rank: 5Comment:
Date: 05/14/02Rank: 5Comment:
Date: 05/14/02Rank: 2Comment:
Date: 05/20/02Rank: 5Comment:
Date: 07/13/02Rank: 5Comment:

Request Information From Our Sponsors
- StockCharts.com, Inc.
- Candle Patterns
- Candlestick Charting Explained
- Intermarket Technical Analysis
- John Murphy on Chart Analysis
- John Murphy's Chart Pattern Recognition
- John Murphy's Market Message
- MurphyExplainsMarketAnalysis-Intermarket Analysis
- MurphyExplainsMarketAnalysis-Visual Analysis
- StockCharts.com
- Technical Analysis of the Financial Markets
- The Visual Investor
- VectorVest, Inc.
- Executive Premier Workshop
- One-Day Options Course
- OptionsPro
- Retirement Income Workshop
- Sure-Fire Trading Systems (VectorVest, Inc.)
- Trading as a Business Workshop
- VectorVest 7 EOD
- VectorVest 7 RealTime/IntraDay
- VectorVest AutoTester
- VectorVest Educational Services
- VectorVest OnLine
- VectorVest Options Analyzer
- VectorVest ProGraphics v6.0
- VectorVest ProTrader 7
- VectorVest RealTime Derby Tool
- VectorVest Simulator
- VectorVest Variator
- VectorVest Watchdog
