HOT TOPICS LIST
- MACD
- Fibonacci
- RSI
- Gann
- ADXR
- Stochastics
- Volume
- Triangles
- Futures
- Cycles
- Volatility
- ZIGZAG
- MESA
- Retracement
- Aroon
INDICATORS LIST
LIST OF TOPICS
PRINT THIS ARTICLE
by Chaitali Mohile
After an intermediate bearish rally, TPCG is likely to regain its bullish strength.
Position: Hold
Chaitali Mohile
Active trader in the Indian stock markets since 2003 and a full-time writer. Trading is largely based upon technical analysis.
PRINT THIS ARTICLE
SUPPORT & RESISTANCE
TPC Group Resuming Bullish Rally?
12/07/11 01:00:35 PMby Chaitali Mohile
After an intermediate bearish rally, TPCG is likely to regain its bullish strength.
Position: Hold
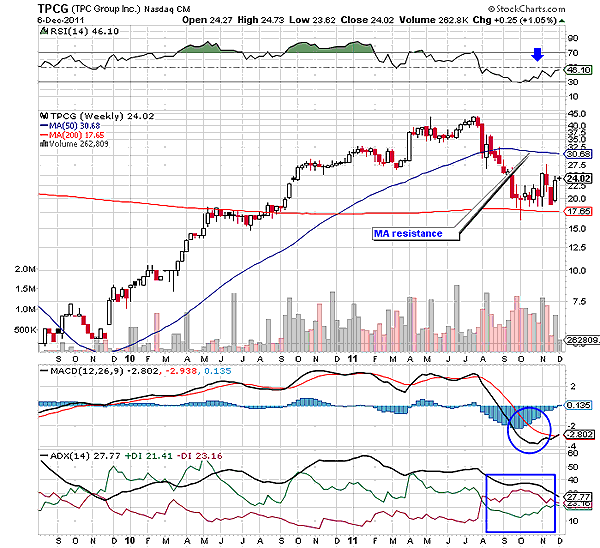
| The 50-day moving average (MA) has been acting as a robust support of TPC Group (TPCG). The price has been following the ascending MA for almost two years. A bullish rally began in mid-2009 from the price level of $5, converting the 50-day MA resistance to support at the very initial stage. Gradually, TPCG followed the ascending direction of the 50-day MA and established support at the 200-day moving average. The relative strength index (RSI) (14) in Figure 1 reached overbought territory as price hit $31. Although the stock surged to $45, the oscillator formed lower highs, indicating a negative divergence for TPCG. As a result, the stock plunged from a new high ($45), violating the 50-day MA support. After declining another 17 points, the stock established support at the 200-day MA in September 2011. The RSI (14) rested at the support of the 30 level. The bearish rally terminated here. |
| The descending rally of TPCG reversed a long-term uptrend. The average directional index (ADX) (14) ruled the uptrend for about two years. According to the weekly chart in Figure 1, an overheated uptrend initiated an intermediate bearish rally. We can see that the buying pressure indicated by the green line and the selling pressure indicated by the red line are converging, highlighting a consolidation period. Hence, the stock entered a short-term consolidation in September. TPCG is stuck in a wide range between the 200-day and 50-day MA support and resistance levels. |

|
| FIGURE 1: TPCG, WEEKLY. The price rally has established strong support at the 200-day MA. The 50-day MA resistance is the upper range of a consolidated rally. |
| Graphic provided by: StockCharts.com. |
| |
| All the three indicators including the moving average convergence/divergence (MACD) (12,26,9) has to turn positive to initiate a fresh bullish breakout rally. Although the trading range is very wide (17 and 30), the confirmed bullish breakout would occur only above the 50-day MA resistance. Till then, the wide range can be definitely traded by short-term and long-term traders. The stock has robust support of the 200-day MA, so this would be an area to keep an eye on. |

|
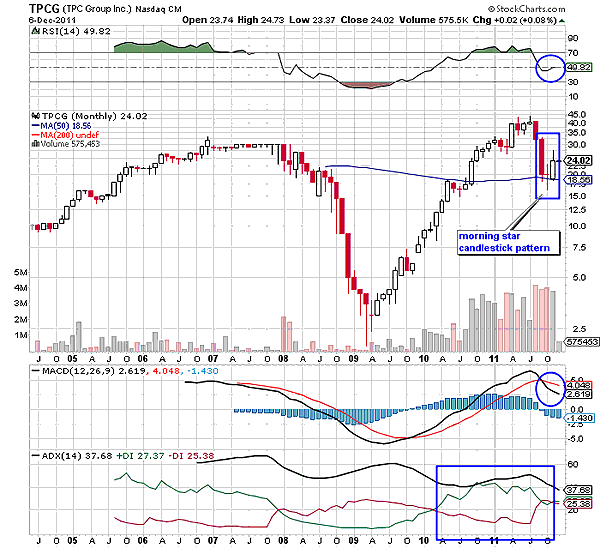
| FIGURE 2: TPCG, MONTHLY |
| Graphic provided by: StockCharts.com. |
| |
| On the monthly time frame in Figure 2, TPCG has formed a morning star candlestick pattern at the 50-day MA. This candlestick pattern is a bullish trend reversal formation that begins a new upward rally. An overheated uptrend in Figure 2 that was generated by a relief rally in 2009 marginally descended in the developed region and is likely to surge once again in the bull's favor. The morning star candlestick pattern would prevent further damage, and TPCG would remain one of the steady bullish stocks in this volatile environment. The RSI (14) is ready to breach the 50 level resistance, which would induce bullish pressure on the current sideways rally. The MACD (12,26,9) is already in positive territory, indicating positive momentum in the rally. |
| Considering both charts, TPCG is likely to trigger the fresh bullish breakout rally in the near future. Long-term traders and investors can trade within the $17 to $30 price range. |
Active trader in the Indian stock markets since 2003 and a full-time writer. Trading is largely based upon technical analysis.
| Company: | Independent |
| Address: | C1/3 Parth Indraprasth Towers. Vastrapur |
| Ahmedabad, Guj 380015 | |
| E-mail address: | chaitalimohile@yahoo.co.in |
Traders' Resource Links | |
| Independent has not added any product or service information to TRADERS' RESOURCE. | |
Click here for more information about our publications!
PRINT THIS ARTICLE

Request Information From Our Sponsors
- StockCharts.com, Inc.
- Candle Patterns
- Candlestick Charting Explained
- Intermarket Technical Analysis
- John Murphy on Chart Analysis
- John Murphy's Chart Pattern Recognition
- John Murphy's Market Message
- MurphyExplainsMarketAnalysis-Intermarket Analysis
- MurphyExplainsMarketAnalysis-Visual Analysis
- StockCharts.com
- Technical Analysis of the Financial Markets
- The Visual Investor
- VectorVest, Inc.
- Executive Premier Workshop
- One-Day Options Course
- OptionsPro
- Retirement Income Workshop
- Sure-Fire Trading Systems (VectorVest, Inc.)
- Trading as a Business Workshop
- VectorVest 7 EOD
- VectorVest 7 RealTime/IntraDay
- VectorVest AutoTester
- VectorVest Educational Services
- VectorVest OnLine
- VectorVest Options Analyzer
- VectorVest ProGraphics v6.0
- VectorVest ProTrader 7
- VectorVest RealTime Derby Tool
- VectorVest Simulator
- VectorVest Variator
- VectorVest Watchdog
