HOT TOPICS LIST
- MACD
- Fibonacci
- RSI
- Gann
- ADXR
- Stochastics
- Volume
- Triangles
- Futures
- Cycles
- Volatility
- ZIGZAG
- MESA
- Retracement
- Aroon
INDICATORS LIST
LIST OF TOPICS
PRINT THIS ARTICLE
by Donald W. Pendergast, Jr.
Shares of Neustar may be setting up for a very low-risk long entry signal.
Position: Buy
Donald W. Pendergast, Jr.
Donald W. Pendergast is a financial markets consultant who offers specialized services to stock brokers and high net worth individuals who seek a better bottom line for their portfolios.
PRINT THIS ARTICLE
TRADING SYSTEMS
Picture-Perfect Buy Setup For NSR?
12/05/11 10:37:26 AMby Donald W. Pendergast, Jr.
Shares of Neustar may be setting up for a very low-risk long entry signal.
Position: Buy
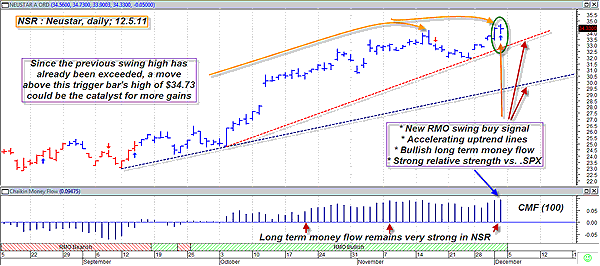
| Shares of Neustar (NSR) have been doing very well since making a major low on August 9, 2011. Since then, the stock has gone from a low of $22.24 all the way to $34.73 on December 2, 2011 -- a gain of more than 56%. Not bad at all, but NSR now seems poised to add on even more gains, based on what we're about to examine on its daily chart (Figure 1). Here's a closer look. |

|
| FIGURE 1: NEUSTAR, DAILY. No trade setup has to work the way we desire, but it still pays to only trade the setups where the largest number of probabilities are in your favor. This daily chart of NSR has many attractive technical features that suggest that the odds are with the bulls on any rise above $34.73. |
| Graphic provided by: MetaStock. |
| Graphic provided by: RMO system indicators from MetaStock 11. |
| |
| To even a novice technical chart analyst, this daily graph of NSR would surely be convincing evidence that the bullish trend in the stock is still alive and well. In fact, let's pretend we're all beginners in the field of analyzing stock charts and start with first things first: 1. At first glance, we would note the series of higher swing highs and higher swing lows, which are the basic ingredients needed to define the existence of an uptrending market. 2. Next, we would begin to plot a long-term trendline and then look to see if any newer lines could be plotted that would indicate that the trend was gaining momentum; obviously it is doing just that on this daily chart. 3. Once having confirmed that a strong trend was in force, a skilled technician would also look at the condition of the medium- to long-term money flow situation. Again, in NSR's case, it's in a very bullish trend. 4. Finally, our beginning chartist might want to locate an objective, mechanical buy signal -- one from a proven system based on sound principles. In the case of NSR, the RMO (Rahul Mohindar) trading system from MetaStock has fired a long entry setup (as of the close on Friday, December 2, 2011), thus adding even more bullish confirmation to the other technicals mentioned. Any rise above Friday's high of $34.73 is sure to attract more than its share of attention from serious traders and money managers, so that is certainly a price level to monitor in NSR going forward. The broad market still seems to be holding on to last week's gains, so that's another hopeful sign for those who may wish to attempt a long entry in NSR in the days ahead. |
| Since the previous swing high of $34.22 has already been exceeded, it doesn't seem to make much sense to set a profit target. No, in this case it might be a better idea to consider using a three-bar trailing stop of the daily lows as both an initial and as a trailing stop until the trade finally makes a daily close below it. Trade management really doesn't get much simpler than that, does it? |
Donald W. Pendergast is a financial markets consultant who offers specialized services to stock brokers and high net worth individuals who seek a better bottom line for their portfolios.
| Title: | Writer, market consultant |
| Company: | Linear Trading Systems LLC |
| Jacksonville, FL 32217 | |
| Phone # for sales: | 904-239-9564 |
| E-mail address: | lineartradingsys@gmail.com |
Traders' Resource Links | |
| Linear Trading Systems LLC has not added any product or service information to TRADERS' RESOURCE. | |
Click here for more information about our publications!
Comments

Request Information From Our Sponsors
- StockCharts.com, Inc.
- Candle Patterns
- Candlestick Charting Explained
- Intermarket Technical Analysis
- John Murphy on Chart Analysis
- John Murphy's Chart Pattern Recognition
- John Murphy's Market Message
- MurphyExplainsMarketAnalysis-Intermarket Analysis
- MurphyExplainsMarketAnalysis-Visual Analysis
- StockCharts.com
- Technical Analysis of the Financial Markets
- The Visual Investor
- VectorVest, Inc.
- Executive Premier Workshop
- One-Day Options Course
- OptionsPro
- Retirement Income Workshop
- Sure-Fire Trading Systems (VectorVest, Inc.)
- Trading as a Business Workshop
- VectorVest 7 EOD
- VectorVest 7 RealTime/IntraDay
- VectorVest AutoTester
- VectorVest Educational Services
- VectorVest OnLine
- VectorVest Options Analyzer
- VectorVest ProGraphics v6.0
- VectorVest ProTrader 7
- VectorVest RealTime Derby Tool
- VectorVest Simulator
- VectorVest Variator
- VectorVest Watchdog
