HOT TOPICS LIST
- MACD
- Fibonacci
- RSI
- Gann
- ADXR
- Stochastics
- Volume
- Triangles
- Futures
- Cycles
- Volatility
- ZIGZAG
- MESA
- Retracement
- Aroon
INDICATORS LIST
LIST OF TOPICS
PRINT THIS ARTICLE
by Mike Carr, CMT
Small speculators and commercials have very different opinions about the NASDAQ 100, and the divergence is bullish for stocks.
Position: Buy
Mike Carr, CMT
Mike Carr, CMT, is a member of the Market Technicians Association, and editor of the MTA's newsletter, Technically Speaking. He is also the author of "Smarter Investing in Any Economy: The Definitive Guide to Relative Strength Investing," and "Conquering the Divide: How to Use Economic Indicators to Catch Stock Market Trends."
PRINT THIS ARTICLE
FUTURES
Bullish Sentiment For NASDAQ 100
12/08/11 10:43:17 AMby Mike Carr, CMT
Small speculators and commercials have very different opinions about the NASDAQ 100, and the divergence is bullish for stocks.
Position: Buy
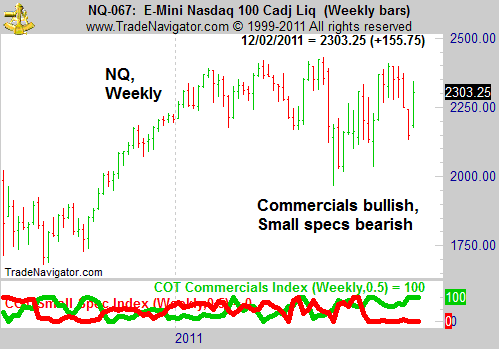
| Each week, the US Commodity Futures Trading Commission releases the Commitment of Traders (COT) report. This data offers insight into what various groups of traders, that is, large speculators, commercials and small speculators, are doing in each futures market. The latest data shows that there is a sharp divergence in the actions of individuals and commercials in the emini NADSAQ 100 contract. Commercials are as bullish as they have been in months, while individual small speculators are equally bearish (Figure 1). |

|
| FIGURE 1: NASDAQ 100, WEEKLY |
| Graphic provided by: Trade Navigator. |
| |
| In Figure 1, COT data has been converted to an index that shows the position of the latest data point relative to where it has been in the past six months. This can be done simply by plugging COT data into a stochastic indicator formula. Trader Larry Williams has written about this technique, and he advises traders to apply the stochastic formula to a variety of data. In this case, it makes the COT data much more useful. |
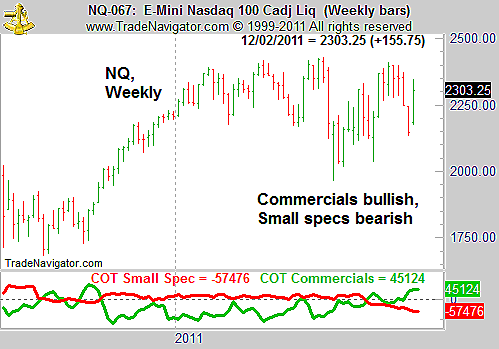
| For comparison, the raw data is shown in Figure 2. The data is unbounded in this chart. Most technicians find data that moves with a predefined range such as zero to 100 to be more useful. The general trend is still visible, but Figure 1 makes it easier to spot significant changes in the buying and selling patterns of each group. |

|
| FIGURE 2: NASDAQ 100, WEEKLY |
| Graphic provided by: Trade Navigator. |
| |
| There was a similar divergence in March 2009 -- right at the stock market bottom, where small specs were bearish while commercials were heavy buyers. Sentiment is a useful indicator, and many traders try to interpret sentiment data from the tone used by guests on CNBC or by the headlines in their local newspapers. Others use sentiment surveys, but these gauge what is being said. COT data shows what real people are doing with real money and is a reliable measure of sentiment, especially when converted into an index. |
| For now, the actions of traders are bullish. But that sentiment can change quickly. |
Mike Carr, CMT, is a member of the Market Technicians Association, and editor of the MTA's newsletter, Technically Speaking. He is also the author of "Smarter Investing in Any Economy: The Definitive Guide to Relative Strength Investing," and "Conquering the Divide: How to Use Economic Indicators to Catch Stock Market Trends."
| Website: | www.moneynews.com/blogs/MichaelCarr/id-73 |
| E-mail address: | marketstrategist@gmail.com |
Click here for more information about our publications!
Comments
Date: 12/06/11Rank: 5Comment:

Request Information From Our Sponsors
- StockCharts.com, Inc.
- Candle Patterns
- Candlestick Charting Explained
- Intermarket Technical Analysis
- John Murphy on Chart Analysis
- John Murphy's Chart Pattern Recognition
- John Murphy's Market Message
- MurphyExplainsMarketAnalysis-Intermarket Analysis
- MurphyExplainsMarketAnalysis-Visual Analysis
- StockCharts.com
- Technical Analysis of the Financial Markets
- The Visual Investor
- VectorVest, Inc.
- Executive Premier Workshop
- One-Day Options Course
- OptionsPro
- Retirement Income Workshop
- Sure-Fire Trading Systems (VectorVest, Inc.)
- Trading as a Business Workshop
- VectorVest 7 EOD
- VectorVest 7 RealTime/IntraDay
- VectorVest AutoTester
- VectorVest Educational Services
- VectorVest OnLine
- VectorVest Options Analyzer
- VectorVest ProGraphics v6.0
- VectorVest ProTrader 7
- VectorVest RealTime Derby Tool
- VectorVest Simulator
- VectorVest Variator
- VectorVest Watchdog
