HOT TOPICS LIST
- MACD
- Fibonacci
- RSI
- Gann
- ADXR
- Stochastics
- Volume
- Triangles
- Futures
- Cycles
- Volatility
- ZIGZAG
- MESA
- Retracement
- Aroon
INDICATORS LIST
LIST OF TOPICS
PRINT THIS ARTICLE
by Koos van der Merwe
The share price has doubled in a month.
Position: Buy
Koos van der Merwe
Has been a technical analyst since 1969, and has worked as a futures and options trader with First Financial Futures in Johannesburg, South Africa.
PRINT THIS ARTICLE
OSCILLATORS
Take A Look At Spectrum Pharma
12/05/11 10:22:23 AMby Koos van der Merwe
The share price has doubled in a month.
Position: Buy
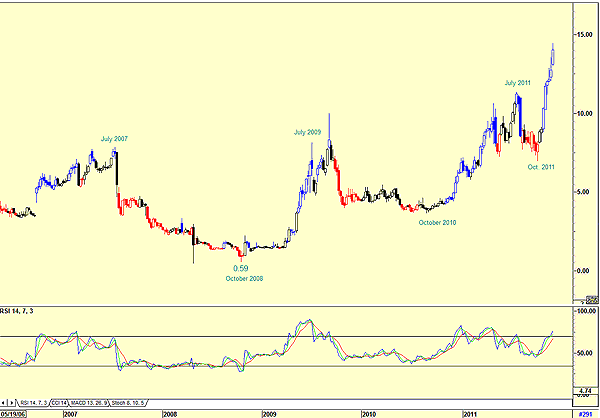
| Looking at the weekly chart (Figure 1), we can see how the price has moved from 59 cents in October 2008 to its present high of $14.04. What is notable is the volatility of the stock, moving in U-shaped formations, with a high in July 2007 followed by a fall into October 2008. This pattern seemed consistent with a high in July 2011. However, the pattern seems to have changed, with the stock falling into October 2011 and then rising strongly to its current price of $14.04. Of course, the movement of the share price is related to fundamentals and its quarterly results, but technical analysis is there to anticipate any major announcement that will be made by measuring general investor sentiment regarding the stock price. Theoretically, the stock price should by all accounts continue rising into July 2012. |

|
| FIGURE 1: SPECTRUM PHARMACEUTICALS, WEEKLY |
| Graphic provided by: AdvancedGET. |
| |
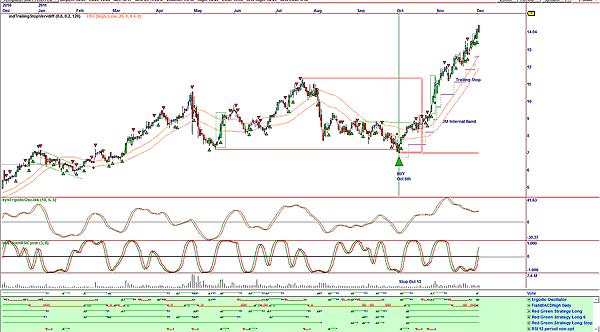
| My daily chart (Figure 2) shows that: 1. The ergodic oscillator suggests a buy. 2. The stochastic relative strength index (RSI) oscillator has moved into buy mode. 3. The JM internal band oscillator gave a buy signal on October 10. 4. A trailing stop has revealed itself as the price rose. 5. The vote line has given a buy signal. This indicator is the result of a buy signal given by the ergodic oscillator strategy and the Fisher moving average convergence/divergence (MACD) high strategy. Note that the red green strategy long, the red green strategy long 6, and the red green strategy long stop are all in buy mode. The red green strategy is where today's price is higher than the price of X days ago. The difference between the three strategies shown depends on how the strategies are formulated regarding exit and stop signals. 6. The buy signal on October 5 was triggered by the RSI 12-period strategy. The two sell signals that followed did not trigger a sell on the vote line because it was overshadowed by the buy signals of the red green strategies. A stop was given on October 13, and we can see how the rise in the stock price hesitated, but the price never fell to the trailing stop level. The ergodic oscillator and the Fisher MACD high also gave sell signals as the price rose, but they were not shown in the vote line. One would have stayed in the stock, keeping a close eye on the trailing stop. With the new buy signal, we would buy the share on a pullback, but after the strong rise, we should be cautious and place stops close to the entry price. |

|
| FIGURE 2: SPECTRUM PHARMACEUTICALS, DAILY |
| Graphic provided by: OmniTrader. |
| |
Has been a technical analyst since 1969, and has worked as a futures and options trader with First Financial Futures in Johannesburg, South Africa.
| Address: | 3256 West 24th Ave |
| Vancouver, BC | |
| Phone # for sales: | 6042634214 |
| E-mail address: | petroosp@gmail.com |
Click here for more information about our publications!
PRINT THIS ARTICLE

|

Request Information From Our Sponsors
- StockCharts.com, Inc.
- Candle Patterns
- Candlestick Charting Explained
- Intermarket Technical Analysis
- John Murphy on Chart Analysis
- John Murphy's Chart Pattern Recognition
- John Murphy's Market Message
- MurphyExplainsMarketAnalysis-Intermarket Analysis
- MurphyExplainsMarketAnalysis-Visual Analysis
- StockCharts.com
- Technical Analysis of the Financial Markets
- The Visual Investor
- VectorVest, Inc.
- Executive Premier Workshop
- One-Day Options Course
- OptionsPro
- Retirement Income Workshop
- Sure-Fire Trading Systems (VectorVest, Inc.)
- Trading as a Business Workshop
- VectorVest 7 EOD
- VectorVest 7 RealTime/IntraDay
- VectorVest AutoTester
- VectorVest Educational Services
- VectorVest OnLine
- VectorVest Options Analyzer
- VectorVest ProGraphics v6.0
- VectorVest ProTrader 7
- VectorVest RealTime Derby Tool
- VectorVest Simulator
- VectorVest Variator
- VectorVest Watchdog
