HOT TOPICS LIST
- MACD
- Fibonacci
- RSI
- Gann
- ADXR
- Stochastics
- Volume
- Triangles
- Futures
- Cycles
- Volatility
- ZIGZAG
- MESA
- Retracement
- Aroon
INDICATORS LIST
LIST OF TOPICS
PRINT THIS ARTICLE
by Donald W. Pendergast, Jr.
Despite its substantial recent selloff, shares of Sears Holdings Corp. still have positive medium-term money flow.
Position: N/A
Donald W. Pendergast, Jr.
Donald W. Pendergast is a financial markets consultant who offers specialized services to stock brokers and high net worth individuals who seek a better bottom line for their portfolios.
PRINT THIS ARTICLE
OVERBOUGHT OVERSOLD
Sears Holdings In Prime Spot For Reversal?
12/02/11 10:06:23 AMby Donald W. Pendergast, Jr.
Despite its substantial recent selloff, shares of Sears Holdings Corp. still have positive medium-term money flow.
Position: N/A
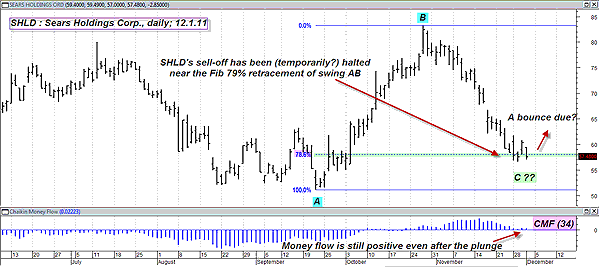
| Trying to interpret a technical chart as a means of projecting a stock or futures contract's next big move is an activity that is fraught with frustration and disgust -- sometimes, anyway. It always seems that when you really need a stock to go a certain way, it won't, and it will in fact seem to take great joy in proving your technical assessment wrong as it travels in the opposite direction. So in the interest of preserving our sanity, we won't attempt to pick a direction for Sears Holdings Corp. (SHLD) but will instead simply weigh some basic technical evidence and plan ahead for what we might do, should the stock put in the appearance of a reversal or if it just decides to keep heading south for a while longer. No harm in at least considering various market scenarios, right? Here's a look at SHLD's daily chart now (Figure 1). |

|
| FIGURE 1: SHLD, DAILY. If the broad markets can continue to rally, odds are reasonably good that traders in SHLD will have an opportunity to get short-term bullish -- in the near term, that is. |
| Graphic provided by: MetaStock. |
| Graphic provided by: Deel Oversold Reversal Screen from MetaStock 11. |
| |
| SHLD dropped steadily throughout November, losing about $27 per share (from around $83 to $56 in only four and a half weeks) with no real pullback or bounce higher along the way. For all that anyone knows, SHLD may just be taking a time out prior to falling some more, but of special note on the chart is the area of support at the Fibonacci 79% retracement of major swing AB. Many times, a reversal will occur at that point if the Fib 62% can't hold prices back, particularly if the money flow is still in positive territory. In this case, that's what we see; the 34-period Chaikin money flow (CMF)(34) has remained above its zero line the entire time the selloff has been in force. Considering how big the decline has been, that's pretty impressive. And even though SHLD didn't seem to rise much during November 30, 2011's astounding broad market rally, it would not be surprising to see traders in this stock just looking for any kind of precipitating market rally as an excuse to rally this stock by $5 or even $10 per share. |
| I found this stock by running a group of 450-plus large-cap stocks through the Deel oversold reversal screen in MetaStock Explorer, and it's a very useful exploration for those traders who want to keep a step ahead of the markets in anticipation of probable bullish reversal situations. Try using it on a mix of large-, small-, and mid-cap stocks when the broad markets make a pullback in the midst of an emerging (or even an established) bullish trend, and you'll likely never lack a decent group of stocks from which to select your next bullish reversal trade setup. |
Donald W. Pendergast is a financial markets consultant who offers specialized services to stock brokers and high net worth individuals who seek a better bottom line for their portfolios.
| Title: | Writer, market consultant |
| Company: | Linear Trading Systems LLC |
| Jacksonville, FL 32217 | |
| Phone # for sales: | 904-239-9564 |
| E-mail address: | lineartradingsys@gmail.com |
Traders' Resource Links | |
| Linear Trading Systems LLC has not added any product or service information to TRADERS' RESOURCE. | |
Click here for more information about our publications!
PRINT THIS ARTICLE

Request Information From Our Sponsors
- StockCharts.com, Inc.
- Candle Patterns
- Candlestick Charting Explained
- Intermarket Technical Analysis
- John Murphy on Chart Analysis
- John Murphy's Chart Pattern Recognition
- John Murphy's Market Message
- MurphyExplainsMarketAnalysis-Intermarket Analysis
- MurphyExplainsMarketAnalysis-Visual Analysis
- StockCharts.com
- Technical Analysis of the Financial Markets
- The Visual Investor
- VectorVest, Inc.
- Executive Premier Workshop
- One-Day Options Course
- OptionsPro
- Retirement Income Workshop
- Sure-Fire Trading Systems (VectorVest, Inc.)
- Trading as a Business Workshop
- VectorVest 7 EOD
- VectorVest 7 RealTime/IntraDay
- VectorVest AutoTester
- VectorVest Educational Services
- VectorVest OnLine
- VectorVest Options Analyzer
- VectorVest ProGraphics v6.0
- VectorVest ProTrader 7
- VectorVest RealTime Derby Tool
- VectorVest Simulator
- VectorVest Variator
- VectorVest Watchdog
