HOT TOPICS LIST
- MACD
- Fibonacci
- RSI
- Gann
- ADXR
- Stochastics
- Volume
- Triangles
- Futures
- Cycles
- Volatility
- ZIGZAG
- MESA
- Retracement
- Aroon
INDICATORS LIST
LIST OF TOPICS
PRINT THIS ARTICLE
by Donald W. Pendergast, Jr.
Lowe's daily chart looks supportive of further gains, if you select the appropriate trading strategy.
Position: Buy
Donald W. Pendergast, Jr.
Donald W. Pendergast is a financial markets consultant who offers specialized services to stock brokers and high net worth individuals who seek a better bottom line for their portfolios.
PRINT THIS ARTICLE
TRADING SYSTEMS
Lowe's Set To Go Higher?
11/30/11 09:47:06 AMby Donald W. Pendergast, Jr.
Lowe's daily chart looks supportive of further gains, if you select the appropriate trading strategy.
Position: Buy
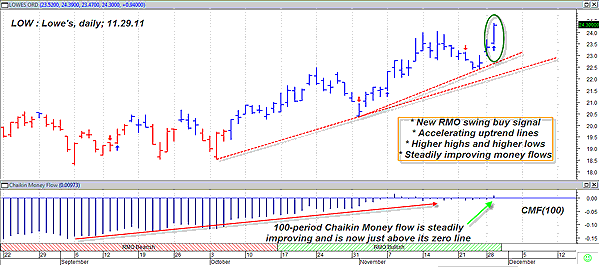
| A powerful trend in motion is an impressive sight on any price chart, but when other key technical factors also align with the trend, it may be that a powerful, low-risk trade setup is developing. Here's a look at one such chart setup in Lowe's (LOW) in Figure 1. |

|
| FIGURE 1: LOW, DAILY. As far as low-risk bullish trade setups go, this one certainly makes the cut. Always have a well-planned exit strategy, however, just in case things don't turn out as anticipated. |
| Graphic provided by: MetaStock. |
| Graphic provided by: RMO system indicators from MetaStock 11. |
| |
| The first item of note isn't exactly hidden -- no, this is one heck of a powerful uptrend depicted on the daily chart. Beginning traders should understand that an uptrend is defined by a series of higher swing highs and higher swing lows and that a downtrend is defined as a series of lower swing highs and lower swing lows. Some trends are a bit erratic, even messy looking, but if you learn to identify the major swing highs and lows, you'll definitely give yourself an edge in the market. Clearly, this is a very clean trend in LOW, what with its very nice proportions between the up- and downswings and even an accelerating trendline now under way. The fact that the RMO (Rahul Mohindar) trading system has just now fired a long swing buy signal only adds fuel to this potentially bullish fire. Undergirding all of these technicals is a steadily strengthening long-term money flow trend (see the 100-period Chaikin money flow histogram at the bottom of the chart). Although it was mired in the depths of bearish territory by the time the early October low was finally in place, note how quickly the flow has rebounded over the past eight weeks -- very impressive -- and that its histogram is actually nosing just above its zero line. All in all, this looks like a great low-risk long trade entry, one that should be helped along if the broad market indexes also can catch a bid and start flying again. Time, as always, will tell. |
| There are at least a few ways to play this particular long setup; if you're the conservative type who'd rather milk a portion of a long-term uptrend, then why not consider buying a near-term (one to two months out until expiry) covered call? Buying a $25 covered call (that is, buy 100 shares (or multiples thereof) of LOW and then sell one January 2012 $25 call option at the same time, preferably in a single buy-write transaction, may help you get a better deal. Once filled on the trade, you can simply use the upper red trendline as your official stop-loss trigger; a daily close below that line means you exit the trade, win or lose. If the line isn't broken on a close, just hold the trade until final expiry on Friday, January 20, 2011. Stock-only traders could simply buy on a move up past $24.39 and then use a two- to three-bar trailing stop of the daily lows as a trade management strategy. If you get a daily close below that trail, you're out, plain and simple. With the broad market perhaps making another attempt at a meaningful year-end rally soon, it might pay to keep a watchlist of long trading signals/setups in the stocks you like to trade. |
Donald W. Pendergast is a financial markets consultant who offers specialized services to stock brokers and high net worth individuals who seek a better bottom line for their portfolios.
| Title: | Writer, market consultant |
| Company: | Linear Trading Systems LLC |
| Jacksonville, FL 32217 | |
| Phone # for sales: | 904-239-9564 |
| E-mail address: | lineartradingsys@gmail.com |
Traders' Resource Links | |
| Linear Trading Systems LLC has not added any product or service information to TRADERS' RESOURCE. | |
Click here for more information about our publications!
PRINT THIS ARTICLE

Request Information From Our Sponsors
- StockCharts.com, Inc.
- Candle Patterns
- Candlestick Charting Explained
- Intermarket Technical Analysis
- John Murphy on Chart Analysis
- John Murphy's Chart Pattern Recognition
- John Murphy's Market Message
- MurphyExplainsMarketAnalysis-Intermarket Analysis
- MurphyExplainsMarketAnalysis-Visual Analysis
- StockCharts.com
- Technical Analysis of the Financial Markets
- The Visual Investor
- VectorVest, Inc.
- Executive Premier Workshop
- One-Day Options Course
- OptionsPro
- Retirement Income Workshop
- Sure-Fire Trading Systems (VectorVest, Inc.)
- Trading as a Business Workshop
- VectorVest 7 EOD
- VectorVest 7 RealTime/IntraDay
- VectorVest AutoTester
- VectorVest Educational Services
- VectorVest OnLine
- VectorVest Options Analyzer
- VectorVest ProGraphics v6.0
- VectorVest ProTrader 7
- VectorVest RealTime Derby Tool
- VectorVest Simulator
- VectorVest Variator
- VectorVest Watchdog
