HOT TOPICS LIST
- MACD
- Fibonacci
- RSI
- Gann
- ADXR
- Stochastics
- Volume
- Triangles
- Futures
- Cycles
- Volatility
- ZIGZAG
- MESA
- Retracement
- Aroon
INDICATORS LIST
LIST OF TOPICS
PRINT THIS ARTICLE
by Koos van der Merwe
W.D. Gann left so much material behind when he died that nobody is quite sure what strategy he used to amass his fortune. Here is one strategy he may have used.
Position: Buy
Koos van der Merwe
Has been a technical analyst since 1969, and has worked as a futures and options trader with First Financial Futures in Johannesburg, South Africa.
PRINT THIS ARTICLE
GANN
Looking At Cycles Through Gann
11/30/11 08:53:00 AMby Koos van der Merwe
W.D. Gann left so much material behind when he died that nobody is quite sure what strategy he used to amass his fortune. Here is one strategy he may have used.
Position: Buy
| Why do cycles work? What is there in the emotions of traders and investors that make them stick to trading at certain time periods? I can understand trading with a dividend-paying stock. You buy after the dividend has been paid, and you sell just before the final day to register for a dividend if the expected growth in the share price is greater than the dividend paid. That cycle is manmade, but cycles in general? Well, you simply have to look at the cycles of tides of the ocean. We all know where that comes from. |

|
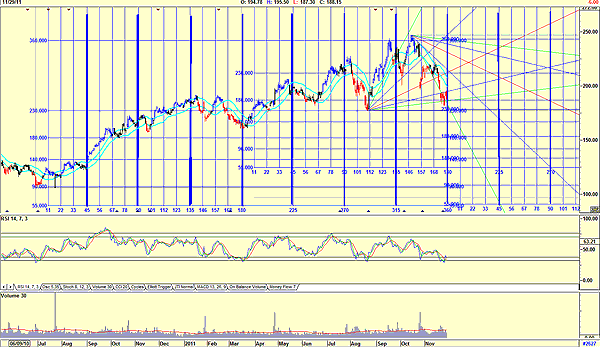
| FIGURE 1: CHART SHOWING GANN CYCLES |
| Graphic provided by: AdvancedGET. |
| |
| Gann himself, however, looked at cycles as a circle of 360 degrees, or time periods. He would divide the 360 into periods of 11, 22, 33, 45, 56, 67, 78, 90, 135, 180, and so on. The divisions are shown on Figure 1. He placed great emphasis on the time periods of 45, 90, and 180, and he regarded the period 90 to 101 as the "death zone," when the stock falls dramatically. Here, Amazon (AMZN) shows how the share price rose from June 29, 2010, to the high on October 12, 2011. I have drawn in Gann time cycles, and the chart shows the major turning points at the 45, 90, and 180 levels. The death zone also shows a fall in the share price in August and September 2011, with the share price falling in the 112 time level. Simply by looking at the chart, we can see how often turning points in the share price occurred at or close to cyclical turning points. Note too the buy sell signals of the relative strength index (RSI). What's up for the future? |

|
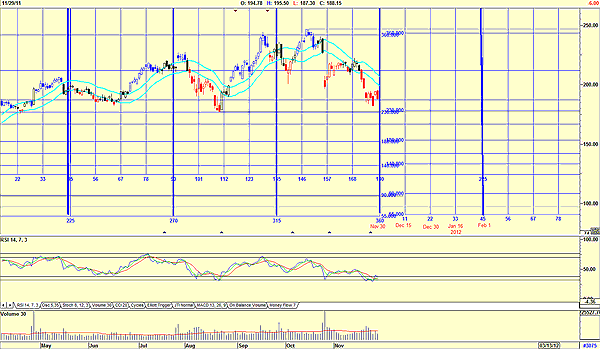
| FIGURE 2: PROJECTING THE FUTURE |
| Graphic provided by: AdvancedGET. |
| |
| In Figure 2, I have enlarged the chart. This shows that at the 360 time mark of November 30, 2011, Amazon should make a major bottom, and start rising into December 15, the 11-cycle period. Future turning points are at December 30, 2011, and January 16, 2012, with a major turning point at February 1, 2012. Do note the RSI is suggesting a major buy. Gann cycles can be used as a guide to buying and selling shares, especially when combined with an indicator. |
Has been a technical analyst since 1969, and has worked as a futures and options trader with First Financial Futures in Johannesburg, South Africa.
| Address: | 3256 West 24th Ave |
| Vancouver, BC | |
| Phone # for sales: | 6042634214 |
| E-mail address: | petroosp@gmail.com |
Click here for more information about our publications!
Comments
Date: 12/14/11Rank: 3Comment:

|

Request Information From Our Sponsors
- StockCharts.com, Inc.
- Candle Patterns
- Candlestick Charting Explained
- Intermarket Technical Analysis
- John Murphy on Chart Analysis
- John Murphy's Chart Pattern Recognition
- John Murphy's Market Message
- MurphyExplainsMarketAnalysis-Intermarket Analysis
- MurphyExplainsMarketAnalysis-Visual Analysis
- StockCharts.com
- Technical Analysis of the Financial Markets
- The Visual Investor
- VectorVest, Inc.
- Executive Premier Workshop
- One-Day Options Course
- OptionsPro
- Retirement Income Workshop
- Sure-Fire Trading Systems (VectorVest, Inc.)
- Trading as a Business Workshop
- VectorVest 7 EOD
- VectorVest 7 RealTime/IntraDay
- VectorVest AutoTester
- VectorVest Educational Services
- VectorVest OnLine
- VectorVest Options Analyzer
- VectorVest ProGraphics v6.0
- VectorVest ProTrader 7
- VectorVest RealTime Derby Tool
- VectorVest Simulator
- VectorVest Variator
- VectorVest Watchdog
