HOT TOPICS LIST
- MACD
- Fibonacci
- RSI
- Gann
- ADXR
- Stochastics
- Volume
- Triangles
- Futures
- Cycles
- Volatility
- ZIGZAG
- MESA
- Retracement
- Aroon
INDICATORS LIST
LIST OF TOPICS
PRINT THIS ARTICLE
by Mike Carr, CMT
The stock market in Japan peaked in 1989 and is still down 80%. Could that happen to the NASDAQ?
Position: Buy
Mike Carr, CMT
Mike Carr, CMT, is a member of the Market Technicians Association, and editor of the MTA's newsletter, Technically Speaking. He is also the author of "Smarter Investing in Any Economy: The Definitive Guide to Relative Strength Investing," and "Conquering the Divide: How to Use Economic Indicators to Catch Stock Market Trends."
PRINT THIS ARTICLE
CHART ANALYSIS
Nikkei And NASDAQ: Two Bear Markets
11/29/11 09:00:26 AMby Mike Carr, CMT
The stock market in Japan peaked in 1989 and is still down 80%. Could that happen to the NASDAQ?
Position: Buy
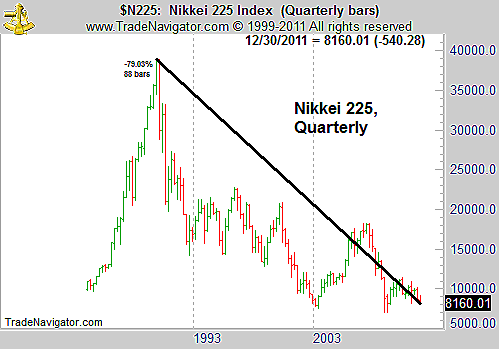
| The length and magnitude of the bear market in Japan has been historic -- 22 years after its peak, the Nikkei 225 index (Figure 1) sits nearly 80% below its all-time high. Buy & hold investors have had no capital gains after 30 years. The market has presented great trading opportunities, meanwhile, and many fortunes could have been made with well-timed trades. |

|
| FIGURE 1: NIKKEI, QUARTERLY. Stocks can go down as well as up in the long term, as the Nikkei 225 index shows. |
| Graphic provided by: Trade Navigator. |
| |
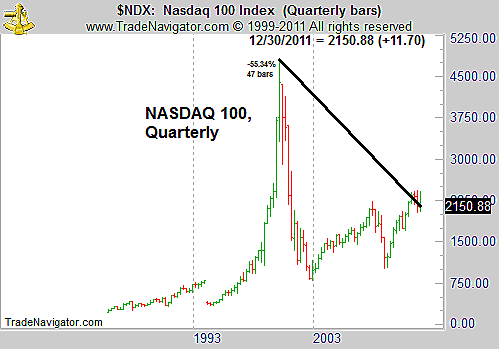
| The NASDAQ Composite (Figure 2) is now 55% below its peak, nearly 12 years after topping. The Nikkei showed a similar loss after 12 years. Traders love to draw comparisons between major market moves like this, and inevitably, the question comes up: Could US investors face another decade of a bear market? |

|
| FIGURE 2: NASDAQ, QUARTERLY. The NASDAQ 100 contains the stocks that drove the Internet bubble and suffered a decline of more than 80% after that peak. |
| Graphic provided by: Trade Navigator. |
| |
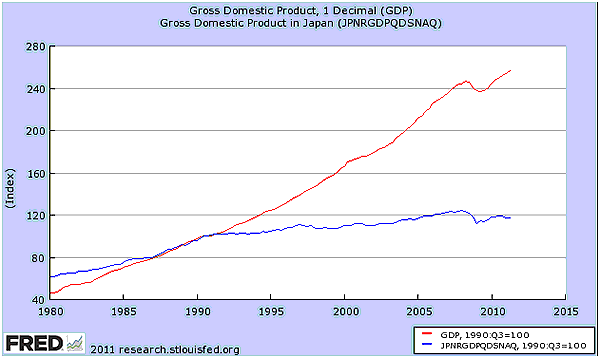
| Prices are ultimately driven by fundamentals, and the economies of Japan and the US have behaved differently. Figure 3 shows the GDP of each nation, with the total value of GDP being indexed to 100 in 1990 for each. We can quickly see that the US grew, while Japan stagnated. This could explain why the Japanese stock market has also stagnated. |

|
| FIGURE 3: GDP, JAPAN. GDP is a fundamental measure that technicians can chart and analyze with the same tools as any price series. |
| Graphic provided by: Federal Reserve. |
| |
| In the long term, fundamentals do affect valuation. The NASDAQ 100 was a bubble in every sense of the word, and it will take time for the index to return to its 2000 peak. However, as long as US economic growth continues, there is no rational reason to expect a decade of underperformance in the index. With an annual return of 8.4%, the NASDAQ 100 would reach new highs within 10 years. That is actually within the range of possibilities, especially if interest rates stay low and the economy grows. |
| For comparison, the Nikkei 225 would need to grow at about 16.9% a year for 10 years to reach a new high. |
Mike Carr, CMT, is a member of the Market Technicians Association, and editor of the MTA's newsletter, Technically Speaking. He is also the author of "Smarter Investing in Any Economy: The Definitive Guide to Relative Strength Investing," and "Conquering the Divide: How to Use Economic Indicators to Catch Stock Market Trends."
| Website: | www.moneynews.com/blogs/MichaelCarr/id-73 |
| E-mail address: | marketstrategist@gmail.com |
Click here for more information about our publications!
Comments

Request Information From Our Sponsors
- StockCharts.com, Inc.
- Candle Patterns
- Candlestick Charting Explained
- Intermarket Technical Analysis
- John Murphy on Chart Analysis
- John Murphy's Chart Pattern Recognition
- John Murphy's Market Message
- MurphyExplainsMarketAnalysis-Intermarket Analysis
- MurphyExplainsMarketAnalysis-Visual Analysis
- StockCharts.com
- Technical Analysis of the Financial Markets
- The Visual Investor
- VectorVest, Inc.
- Executive Premier Workshop
- One-Day Options Course
- OptionsPro
- Retirement Income Workshop
- Sure-Fire Trading Systems (VectorVest, Inc.)
- Trading as a Business Workshop
- VectorVest 7 EOD
- VectorVest 7 RealTime/IntraDay
- VectorVest AutoTester
- VectorVest Educational Services
- VectorVest OnLine
- VectorVest Options Analyzer
- VectorVest ProGraphics v6.0
- VectorVest ProTrader 7
- VectorVest RealTime Derby Tool
- VectorVest Simulator
- VectorVest Variator
- VectorVest Watchdog
