HOT TOPICS LIST
- MACD
- Fibonacci
- RSI
- Gann
- ADXR
- Stochastics
- Volume
- Triangles
- Futures
- Cycles
- Volatility
- ZIGZAG
- MESA
- Retracement
- Aroon
INDICATORS LIST
LIST OF TOPICS
PRINT THIS ARTICLE
by Donald W. Pendergast, Jr.
Shares of Cameron International are already in the midst of a substantial down swing. Is this latest Raff MarketSpace stock system sell signal too late?
Position: N/A
Donald W. Pendergast, Jr.
Donald W. Pendergast is a financial markets consultant who offers specialized services to stock brokers and high net worth individuals who seek a better bottom line for their portfolios.
PRINT THIS ARTICLE
TRADING SYSTEMS
Cameron Int'l New Short Signal
11/28/11 10:19:59 AMby Donald W. Pendergast, Jr.
Shares of Cameron International are already in the midst of a substantial down swing. Is this latest Raff MarketSpace stock system sell signal too late?
Position: N/A
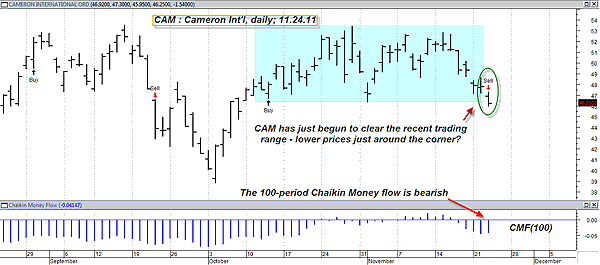
| One of the sometimes-difficult aspects of trading with a mechanical system is that the trading signals don't always appear at the time or location on the chart that you might prefer. Take this daily chart of Cameron International (CAM), for example (Figure 1): Clearly, this stock has already made significant downside progress since it decided to sell off about a week and a half ago (November 15). Yet here we have a new short sell signal, even though CAM has already shed more than $6 per share. So is it too late to jump on this southbound train now? To answer this question properly, a trader needs to first evaluate the back- and forward-test results of the system, preferably over a very large number of trades occurring over a substantial piece of historical data. Only by doing this can a trader get some confidence in the system's output, no matter when a signal may arrive. Of course, there are no backtested results available for the Raff MarketSpace stock system expert advisor in MetaStock, but the principle of examining trades can still be useful here. If you go back and examine a large number of trades with this particular expert applied to a chart, you'll usually come away with a pretty good feel as to whether the system is profitable. In the case of CAM, this system does indeed appear to be able to deliver profits over time. |

|
| FIGURE 1: CAM, DAILY. To be truly successful at system trading, you need to be willing to take every signal that a good system generates, no matter how illogical it may appear on the chart. |
| Graphic provided by: MetaStock. |
| Graphic provided by: Raff MarketSpace stock system from MetaStock. |
| |
| Once you've either visually or mathematically verified that the system is profitable, you still need to decide on the following: 1. How many shares to buy, based on how much risk to the account will be allowed 2. How to enter the position (market, limit, or stop orders) 3. How to manage the position until the final exit is reached (via profit target, initial stop-loss, trailing stop-loss, time exit, number of bars exit, and so on). You can also apply comparative relative strength analysis, sector/group rotation principles, and seasonal tendency studies to your stock trading strategy. It's really up to you how thorough you want to make it. Your trading results will be the best guide as to whether your stock screening and management process needs a bit more tweaking. With the vast amounts of potential market profits available to skilled traders, this might be a very good use of your time indeed. |
Donald W. Pendergast is a financial markets consultant who offers specialized services to stock brokers and high net worth individuals who seek a better bottom line for their portfolios.
| Title: | Writer, market consultant |
| Company: | Linear Trading Systems LLC |
| Jacksonville, FL 32217 | |
| Phone # for sales: | 904-239-9564 |
| E-mail address: | lineartradingsys@gmail.com |
Traders' Resource Links | |
| Linear Trading Systems LLC has not added any product or service information to TRADERS' RESOURCE. | |
Click here for more information about our publications!
PRINT THIS ARTICLE

Request Information From Our Sponsors
- StockCharts.com, Inc.
- Candle Patterns
- Candlestick Charting Explained
- Intermarket Technical Analysis
- John Murphy on Chart Analysis
- John Murphy's Chart Pattern Recognition
- John Murphy's Market Message
- MurphyExplainsMarketAnalysis-Intermarket Analysis
- MurphyExplainsMarketAnalysis-Visual Analysis
- StockCharts.com
- Technical Analysis of the Financial Markets
- The Visual Investor
- VectorVest, Inc.
- Executive Premier Workshop
- One-Day Options Course
- OptionsPro
- Retirement Income Workshop
- Sure-Fire Trading Systems (VectorVest, Inc.)
- Trading as a Business Workshop
- VectorVest 7 EOD
- VectorVest 7 RealTime/IntraDay
- VectorVest AutoTester
- VectorVest Educational Services
- VectorVest OnLine
- VectorVest Options Analyzer
- VectorVest ProGraphics v6.0
- VectorVest ProTrader 7
- VectorVest RealTime Derby Tool
- VectorVest Simulator
- VectorVest Variator
- VectorVest Watchdog
