

HOT TOPICS LIST
- MACD
- Fibonacci
- RSI
- Gann
- ADXR
- Stochastics
- Volume
- Triangles
- Futures
- Cycles
- Volatility
- ZIGZAG
- MESA
- Retracement
- Aroon
INDICATORS LIST
LIST OF TOPICS
PRINT THIS ARTICLE
by Koos van der Merwe
A trumpet formation is a sign of uncertainty. Is this what is happening to the indexes?
Position: N/A
Koos van der Merwe
Has been a technical analyst since 1969, and has worked as a futures and options trader with First Financial Futures in Johannesburg, South Africa.
PRINT THIS ARTICLE
TRIANGLES
Blowing A Trumpet (Formation)
11/23/11 09:38:28 AMby Koos van der Merwe
A trumpet formation is a sign of uncertainty. Is this what is happening to the indexes?
Position: N/A
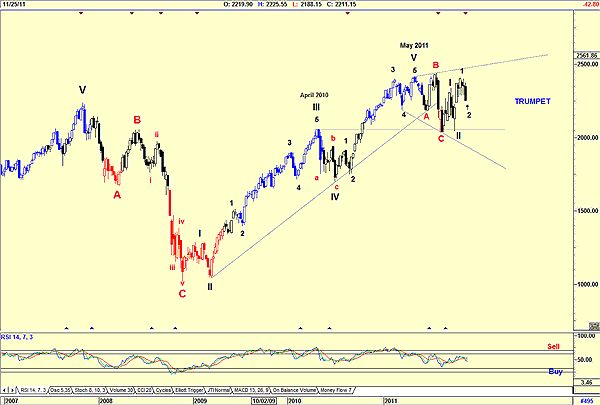
| The NASDAQ is suggesting the formation of a trumpet. Trumpet pattern formations are a sign of uncertainty. The index is not quite sure whether its trend is up or down. With the present uncertainty in the world, I am not at all surprised. There's uncertainty in Europe, there's uncertainty in the US about the Presidential election in 2012, with Republicans attempting to tarnish President Obama's financial and health policies, and finally, there's uncertainty with world weather patterns causing havoc with major industrial nations. With all that going on, it has become a game of guessing, "What's next?" My charts are both of the NASDAQ weekly index, with different Elliott wave counts. |
|
| FIGURE 1: NASDAQ, WEEKLY |
| Graphic provided by: AdvancedGET. |
| |
| Figure 1 shows the trumpet pattern that has formed. The Elliott wave count shows that a wave V topped in May 2011, and the index then fell in an ABC pattern. The chart shows that wave C fell into the fourth wave of lesser degree, which is expected of a correction. However, as you can see on the chart, it just made it. With the count of the new bull market looking suspect, and the relative strength index (RSI) not falling to the buy zone, I am more inclined to look at the next chart as being the true wave count. |
|
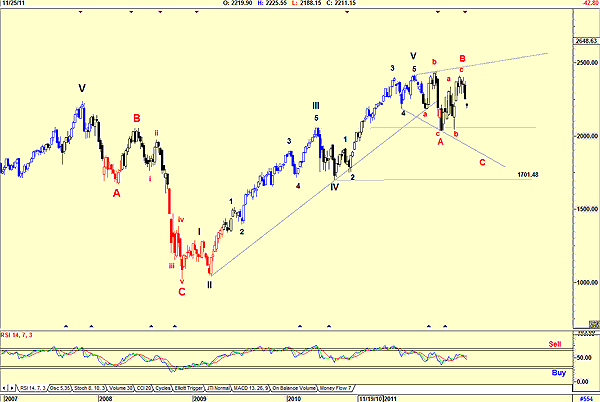
| FIGURE 2: NASDAQ, WEEKLY |
| Graphic provided by: AdvancedGET. |
| |
| The count in Figure 2 suggests further downside, with wave C possibly falling as low as 1701.48, the lower level of the fourth wave of lesser degree. Should this occur, it will happen in five waves, which will take us well into December, if not January 2012. The NASDAQ is currently tracing a trumpet pattern, a pattern of uncertainty. Negativity in the index seems the most likely. |
Has been a technical analyst since 1969, and has worked as a futures and options trader with First Financial Futures in Johannesburg, South Africa.
| Address: | 3256 West 24th Ave |
| Vancouver, BC | |
| Phone # for sales: | 6042634214 |
| E-mail address: | petroosp@gmail.com |
Click here for more information about our publications!
Comments

Request Information From Our Sponsors
- StockCharts.com, Inc.
- Candle Patterns
- Candlestick Charting Explained
- Intermarket Technical Analysis
- John Murphy on Chart Analysis
- John Murphy's Chart Pattern Recognition
- John Murphy's Market Message
- MurphyExplainsMarketAnalysis-Intermarket Analysis
- MurphyExplainsMarketAnalysis-Visual Analysis
- StockCharts.com
- Technical Analysis of the Financial Markets
- The Visual Investor
- VectorVest, Inc.
- Executive Premier Workshop
- One-Day Options Course
- OptionsPro
- Retirement Income Workshop
- Sure-Fire Trading Systems (VectorVest, Inc.)
- Trading as a Business Workshop
- VectorVest 7 EOD
- VectorVest 7 RealTime/IntraDay
- VectorVest AutoTester
- VectorVest Educational Services
- VectorVest OnLine
- VectorVest Options Analyzer
- VectorVest ProGraphics v6.0
- VectorVest ProTrader 7
- VectorVest RealTime Derby Tool
- VectorVest Simulator
- VectorVest Variator
- VectorVest Watchdog