HOT TOPICS LIST
- MACD
- Fibonacci
- RSI
- Gann
- ADXR
- Stochastics
- Volume
- Triangles
- Futures
- Cycles
- Volatility
- ZIGZAG
- MESA
- Retracement
- Aroon
INDICATORS LIST
LIST OF TOPICS
PRINT THIS ARTICLE
by Mike Carr, CMT
The Value Line Index shows that stocks have gone nowhere for 16 years, but traders have enjoyed sizable moves in both directions.
Position: Buy
Mike Carr, CMT
Mike Carr, CMT, is a member of the Market Technicians Association, and editor of the MTA's newsletter, Technically Speaking. He is also the author of "Smarter Investing in Any Economy: The Definitive Guide to Relative Strength Investing," and "Conquering the Divide: How to Use Economic Indicators to Catch Stock Market Trends."
PRINT THIS ARTICLE
RSI
Stocks For The Long Term? Looking At Value Line
11/22/11 02:12:37 PMby Mike Carr, CMT
The Value Line Index shows that stocks have gone nowhere for 16 years, but traders have enjoyed sizable moves in both directions.
Position: Buy
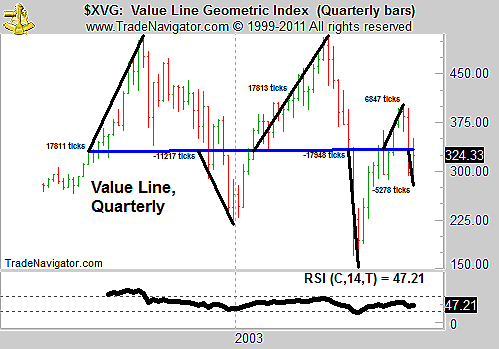
| In July 1995, the Value Line Index closed near 323, about the same price as it was in November 2011. Then there's Value Line Geometric Index, an equally weighted index of all the stocks included in the Value Line survey calculated with a geometric average (Figure 1). A geometric index is calculating by multiplying the daily percentage price changes of each stock in the index and taking the nth root of that product, with n being equal to the number of stocks in the index. A geometric average represents the median stock's daily percentage price change and shows what the average stock has done over time. The market performance of the average stock has now been flat for 16 years. |
| During that time, there have been very large moves to both the upside and downside. The major trends have offered significant trading opportunities. |

|
| FIGURE 1: VALUE LIINE GEOMETRIC INDEX, QUARTERLY. The Value Line Geometric Index has shown wide price swings without any real gains since 1995. |
| Graphic provided by: Trade Navigator. |
| |
| The all-time high in this index was reached in April 1998, about 180 points higher than the price reached in the second quarter of 2011. In 2003, after breaking above 323 again, traders enjoyed an up move of almost the exact same magnitude, with the peak coming within one point of the all-time high. |
| The summer decline in stocks once again brought prices below the level reached in 1995. The relative strength index (RSI) stayed bullish during the decline, and stocks may finally be set up for an extended bull market. |
| Many analysts like to point out those times when markets went nowhere for more than 15 years. The 1966 to 1982 period is widely cited, as is 1929 to 1954. We are currently experiencing another such period of flat markets that started in the mid-1990s. Given the fact that the RSI held within a bullish range at the recent lows, we may finally be ending that period and moving toward new all-time highs later in the decade. |
Mike Carr, CMT, is a member of the Market Technicians Association, and editor of the MTA's newsletter, Technically Speaking. He is also the author of "Smarter Investing in Any Economy: The Definitive Guide to Relative Strength Investing," and "Conquering the Divide: How to Use Economic Indicators to Catch Stock Market Trends."
| Website: | www.moneynews.com/blogs/MichaelCarr/id-73 |
| E-mail address: | marketstrategist@gmail.com |
Click here for more information about our publications!
PRINT THIS ARTICLE

Request Information From Our Sponsors
- StockCharts.com, Inc.
- Candle Patterns
- Candlestick Charting Explained
- Intermarket Technical Analysis
- John Murphy on Chart Analysis
- John Murphy's Chart Pattern Recognition
- John Murphy's Market Message
- MurphyExplainsMarketAnalysis-Intermarket Analysis
- MurphyExplainsMarketAnalysis-Visual Analysis
- StockCharts.com
- Technical Analysis of the Financial Markets
- The Visual Investor
- VectorVest, Inc.
- Executive Premier Workshop
- One-Day Options Course
- OptionsPro
- Retirement Income Workshop
- Sure-Fire Trading Systems (VectorVest, Inc.)
- Trading as a Business Workshop
- VectorVest 7 EOD
- VectorVest 7 RealTime/IntraDay
- VectorVest AutoTester
- VectorVest Educational Services
- VectorVest OnLine
- VectorVest Options Analyzer
- VectorVest ProGraphics v6.0
- VectorVest ProTrader 7
- VectorVest RealTime Derby Tool
- VectorVest Simulator
- VectorVest Variator
- VectorVest Watchdog
