HOT TOPICS LIST
- MACD
- Fibonacci
- RSI
- Gann
- ADXR
- Stochastics
- Volume
- Triangles
- Futures
- Cycles
- Volatility
- ZIGZAG
- MESA
- Retracement
- Aroon
INDICATORS LIST
LIST OF TOPICS
PRINT THIS ARTICLE
by Donald W. Pendergast, Jr.
The projection of a measured move from one price level to another isn't a new technical concept, but it's still one that has merit.
Position: Buy
Donald W. Pendergast, Jr.
Donald W. Pendergast is a financial markets consultant who offers specialized services to stock brokers and high net worth individuals who seek a better bottom line for their portfolios.
PRINT THIS ARTICLE
TRADING SYSTEMS
Is Autodesk Preparing For A Measured Move Higher?
11/18/11 09:06:46 AMby Donald W. Pendergast, Jr.
The projection of a measured move from one price level to another isn't a new technical concept, but it's still one that has merit.
Position: Buy
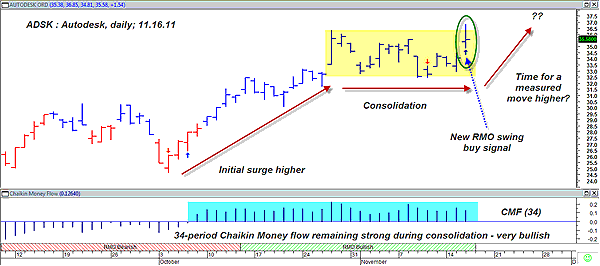
| From a chartist's perspective it certainly does seem as if the broad US markets are in a controlled trading range, patiently awaiting their next precipitating event that will launch them higher during the final six weeks of 2011 and on into 2012. This stock example is also in a very well-defined range, but it has just fired a long entry setup signal, one that needs a minor move higher to trigger a buy. Here's a look at the daily technical chart of Autodesk (Figure 1). |

|
| FIGURE 1: ADSK, DAILY. A chart as "textbook" as this one is sure to inspire many a bullish prognosticator to assign any number of price targets to this particular stock. |
| Graphic provided by: MetaStock. |
| Graphic provided by: RMO system indicators from MetaStock 11. |
| |
| When technicians refer to a measured move, they're talking about a stock or commodity that has made a significant, sustained move higher (lower) before going into a well-defined trading range. As the consolidation plays out, they then attempt to project a possible price target for the next significant swing higher (lower) out of the pattern, which is typically based on a multiple of the original distance traveled by the original thrust that got the pattern started in the first place. In the case of our daily chart of Autodesk (ADSK), we find that the first upthrust netted nearly $12 in gains (extreme swing low to the final peak before the range formed) before moving into sideways mode for the last three weeks. With the new advent of the MetaStock Rahul Mohindar (RMO) swing buy signal (green oval on chart), it may be that ADSK is tipping its hand regarding its next intended trend thrust, which may very well be higher. Since the width of the consolidation is approximately $4, to arrive at a possible price target for a move higher out of the range, simply divide $4 by 2, which is 2. Now add $2 to the lowest point of the range ($32.41) to arrive at a figure of $34.41. Using a set of Fibonacci ratios, we can now plot several "mild to wild" price projections for our use: Original thrust of $12 * 0.382 = $4.58 Range midpoint of $34.41 + $4.58 = $38.99 [1st target] Original thrust of $12 * 0.618 = $7.42 Range midpoint of $34.41 + $7.42 = $41.83 [2nd target] Original thrust of $12 * 1.00 = $12.00 Range midpoint of $34.41 + $12.00 = $46.41 [3rd target] In one sense, this appears to be nothing more than playing with numbers, but in reality, such calculations can still be useful for various kinds of traders, particularly those who like to take profits rather than holding a position as a trend-following move. For one way to use this, consider the following -- perhaps you go long ADSK on a break above Wednesday's high of $ 36.85, with the intention of taking a third of your profits (if any materialize, of course) at target 1, the next third at target 2, and the balance at target 3. Or maybe you simply scale out on halves at targets 1 and 2 and don't even hang around for a longer-term move. How you use these calculations simply depends on your trading temperament and beliefs about the strength of any given trend. You can easily plot such calculations in Excel and will no doubt be able to find may interesting uses for them as you trade the markets. Take some time and use these ideas and see if it's a good fit with your own trading style. |
Donald W. Pendergast is a financial markets consultant who offers specialized services to stock brokers and high net worth individuals who seek a better bottom line for their portfolios.
| Title: | Writer, market consultant |
| Company: | Linear Trading Systems LLC |
| Jacksonville, FL 32217 | |
| Phone # for sales: | 904-239-9564 |
| E-mail address: | lineartradingsys@gmail.com |
Traders' Resource Links | |
| Linear Trading Systems LLC has not added any product or service information to TRADERS' RESOURCE. | |
Click here for more information about our publications!
PRINT THIS ARTICLE

Request Information From Our Sponsors
- StockCharts.com, Inc.
- Candle Patterns
- Candlestick Charting Explained
- Intermarket Technical Analysis
- John Murphy on Chart Analysis
- John Murphy's Chart Pattern Recognition
- John Murphy's Market Message
- MurphyExplainsMarketAnalysis-Intermarket Analysis
- MurphyExplainsMarketAnalysis-Visual Analysis
- StockCharts.com
- Technical Analysis of the Financial Markets
- The Visual Investor
- VectorVest, Inc.
- Executive Premier Workshop
- One-Day Options Course
- OptionsPro
- Retirement Income Workshop
- Sure-Fire Trading Systems (VectorVest, Inc.)
- Trading as a Business Workshop
- VectorVest 7 EOD
- VectorVest 7 RealTime/IntraDay
- VectorVest AutoTester
- VectorVest Educational Services
- VectorVest OnLine
- VectorVest Options Analyzer
- VectorVest ProGraphics v6.0
- VectorVest ProTrader 7
- VectorVest RealTime Derby Tool
- VectorVest Simulator
- VectorVest Variator
- VectorVest Watchdog
