HOT TOPICS LIST
- MACD
- Fibonacci
- RSI
- Gann
- ADXR
- Stochastics
- Volume
- Triangles
- Futures
- Cycles
- Volatility
- ZIGZAG
- MESA
- Retracement
- Aroon
INDICATORS LIST
LIST OF TOPICS
PRINT THIS ARTICLE
by Koos van der Merwe
The US stock market has been depressing as Europe struggles to get back on its feet.
Position: Buy
Koos van der Merwe
Has been a technical analyst since 1969, and has worked as a futures and options trader with First Financial Futures in Johannesburg, South Africa.
PRINT THIS ARTICLE
TRIANGLES
Is That A Triangle I See Before Me?
11/17/11 10:07:00 AMby Koos van der Merwe
The US stock market has been depressing as Europe struggles to get back on its feet.
Position: Buy
| If it is not Greece, then it is Italy, and if not Italy, then probably Portugal or some other European country's uncertainty that affects the market. However the indexes are starting to show an interesting pattern, the formation of a symmetrical triangle. Triangles act as a period of consolidation, from which prices continue to move in the same direction. They form as a result of indecision between buyers and sellers. Market participants tend to withdraw to the sidelines, resulting in narrower market fluctuations and diminishing volume. A breakout of the triangle usually occurs as a result of some news affecting the market. This breakout, if legitimate, always occurs with an increase in volume. |

|
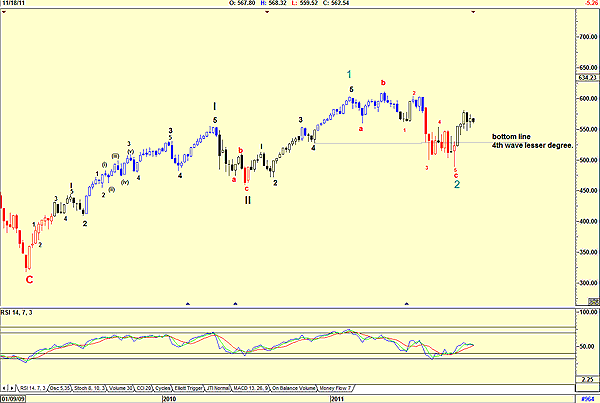
| FIGURE 1: S&P 100, WEEKLY |
| Graphic provided by: AdvancedGET. |
| |
| Figure 1 is a weekly chart of the Standard & Poor's 100 index. My Elliott wave count is confusing, suggesting that the index is tracing a wave 2 of wave III. This is confusing, because by all accounts the count should be wave III and wave IV, but because wave IV would be below the fourth wave of lesser degree as shown on the chart, I have no option but to change the count to waves 1 and 2 of wave III. Never forget, Elliott wave is simply a signpost in the wilderness, and there is always another signpost a ways down the road. Do note that the relative strength index (RSI) with its two moving averages, 7 and 3, is suggesting strength. |

|
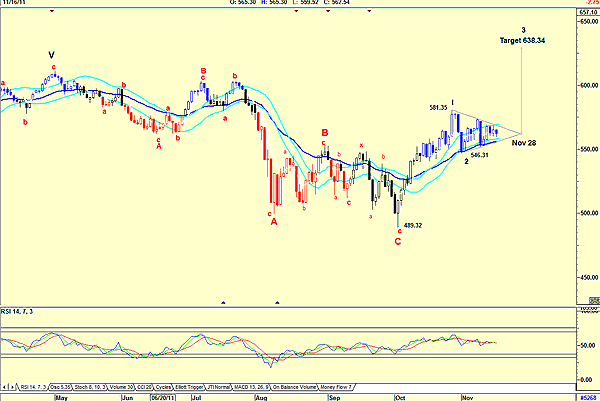
| FIGURE 2: S&P 100, DAILY |
| Graphic provided by: AdvancedGET. |
| |
| Figure 2 is a daily chart. Note that my wave count differs to that of the weekly chart, in that I have shown a wave V as complete with an ABC correction, and that a new bull trend has started. Note also that the index has formed an equilateral triangle. The triangle is suggesting a target of 638.34 (581.35-489.32=92.03+546.31=638.34), with a date suggested by the apex of November 28. Should this occur, it would be wave 3 of a new bull market. With wave 2 a complicated triangle, wave 4 will be a simple correction, or a correction that is even more complicated than wave 2. With the months till the end of March, usually being the best months for the market, I am inclined towards a simple wave 4 correction. There is no doubt in my mind that the indexes are entering a new bull market. All the signs point to it. |
Has been a technical analyst since 1969, and has worked as a futures and options trader with First Financial Futures in Johannesburg, South Africa.
| Address: | 3256 West 24th Ave |
| Vancouver, BC | |
| Phone # for sales: | 6042634214 |
| E-mail address: | petroosp@gmail.com |
Click here for more information about our publications!
Comments
Date: 11/18/11Rank: Comment: According to Elliott Wave theory Triangles never occur in 2nd Waves! ONly in 4th and sometimes in B Waves!
Therefore could you mean B wave instead of 2?

Request Information From Our Sponsors
- VectorVest, Inc.
- Executive Premier Workshop
- One-Day Options Course
- OptionsPro
- Retirement Income Workshop
- Sure-Fire Trading Systems (VectorVest, Inc.)
- Trading as a Business Workshop
- VectorVest 7 EOD
- VectorVest 7 RealTime/IntraDay
- VectorVest AutoTester
- VectorVest Educational Services
- VectorVest OnLine
- VectorVest Options Analyzer
- VectorVest ProGraphics v6.0
- VectorVest ProTrader 7
- VectorVest RealTime Derby Tool
- VectorVest Simulator
- VectorVest Variator
- VectorVest Watchdog
- StockCharts.com, Inc.
- Candle Patterns
- Candlestick Charting Explained
- Intermarket Technical Analysis
- John Murphy on Chart Analysis
- John Murphy's Chart Pattern Recognition
- John Murphy's Market Message
- MurphyExplainsMarketAnalysis-Intermarket Analysis
- MurphyExplainsMarketAnalysis-Visual Analysis
- StockCharts.com
- Technical Analysis of the Financial Markets
- The Visual Investor
