HOT TOPICS LIST
- MACD
- Fibonacci
- RSI
- Gann
- ADXR
- Stochastics
- Volume
- Triangles
- Futures
- Cycles
- Volatility
- ZIGZAG
- MESA
- Retracement
- Aroon
INDICATORS LIST
LIST OF TOPICS
PRINT THIS ARTICLE
by Billy Williams
Cup & handle patterns can result in huge profits but only if they are formed properly -- otherwise they can cause your trade to fall apart.
Position: Hold
Billy Williams
Billy Williams has been trading the markets for 27 years, specializing in momentum trading with stocks and options.
PRINT THIS ARTICLE
CHART ANALYSIS
How To Spot Proper Handle Formations
11/17/11 10:03:15 AMby Billy Williams
Cup & handle patterns can result in huge profits but only if they are formed properly -- otherwise they can cause your trade to fall apart.
Position: Hold
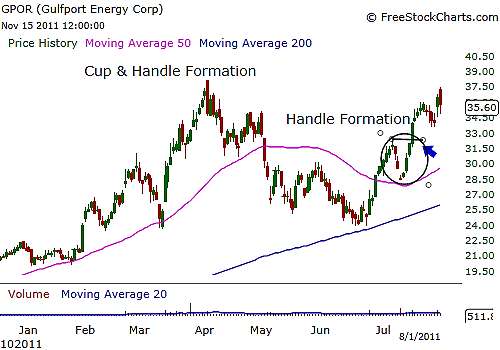
| Cup & handle formations were made famous by William O'Neil, who is considered by some to be the godfather of momentum trading for his work on quantifying the key characteristics of high-flying momentum stocks as well as his book, "How To Make Money In Stocks," which details the studies that he developed on the subject. These price patterns are commonly revealed in stocks that are about to make fast-moving runaway moves, but not all cup & handle patterns are equal, and if you don't know what a proper formation of this pattern entails, then you might find yourself frustrated when a trade based on this pattern doesn't work out as planned. The entry point for a cup & handle formation is the "handle" portion of the pattern, which forms as price recovers from the lower level of the pattern and begins to climb to test its former high before falling to the bottom of the pattern's "cup" level. As price begins to climb to its former highs, price will then begin to experience consolidation or a slight pullback to shake out any weak traders and then trade up through the high point of the handle portion of the pattern. This is the entry point. See Figure 1. |

|
| FIGURE 1: GPOR. GPOR formed a cup & handle pattern after setting an all-time price high on April 4, 2011, but note that the "handle" portion of the pattern formed at the lower half of the price range, which is a sign of a weak pattern. |
| Graphic provided by: www.freestockcharts.com. |
| |
| However, a properly formed handle will develop in the upper half of the price range of the cup & handle pattern. If a handle develops in the lower half, then the pattern is weak and may lack the ability to follow through to the upside. For example, Gulfport Energy Corp. (GPOR), is a fundamentally strong stock that has equally compelling traits that garner a closer look over the last year. Sales growth has been an impressive 71% in the second quarter followed by 90% in the third quarter, accompanied by earnings growth of 138% and 104%, respectively, in the same quarters as well. The industry ranks 24 on high performance, so it is in a strongly performing sector of the overall market and the stock itself has up/down volume readings of 2.0, revealing strong bullish trading in GPOR. |

|
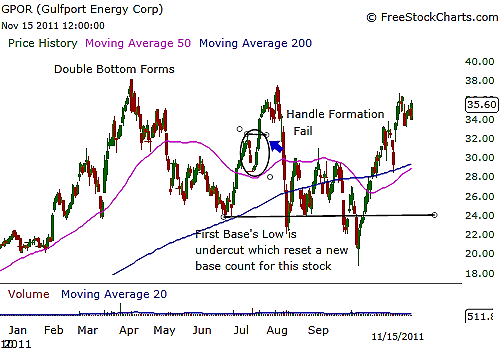
| FIGURE 2: GPOR. Price declined after a brief runup and undercut the former price low of the previous price base, which reset the base count back to "1." A double-bottom pattern has formed with an entry point right above the former high set on April 4, 2011. |
| Graphic provided by: www.freestockcharts.com. |
| |
| On April 4, 2011, GPOR reached an all-time price high before declining to the "bottom" of the cup and then began to climb higher. During this period of price contraction, a price base was formed as GPOR began to climb back to its price highs, but not before forming the handle portion of its pattern. However, note that GPOR formed a handle in the lower half of that pattern's price range, which was a signal to approach this trade with caution. Again, properly formed handles form in the upper half of the price range for a strong cup & handle pattern. A breakout occurred on July 18, 2011, for GPOR and, after a brief run, the stock began to decline from a high of $37.49. |
| Price eventually declined below the bottom of the cup low and this resulted in an undercutting of the former price base. Since the low was broken by the current price action, it invalidated the former base and a new base 1 was formed. In the current overall price base, a double-bottom pattern was formed with an entry point above the price high of April 4, 2011. |
Billy Williams has been trading the markets for 27 years, specializing in momentum trading with stocks and options.
| Company: | StockOptionSystem.com |
| E-mail address: | stockoptionsystem.com@gmail.com |
Traders' Resource Links | |
| StockOptionSystem.com has not added any product or service information to TRADERS' RESOURCE. | |
Click here for more information about our publications!
PRINT THIS ARTICLE

|

Request Information From Our Sponsors
- StockCharts.com, Inc.
- Candle Patterns
- Candlestick Charting Explained
- Intermarket Technical Analysis
- John Murphy on Chart Analysis
- John Murphy's Chart Pattern Recognition
- John Murphy's Market Message
- MurphyExplainsMarketAnalysis-Intermarket Analysis
- MurphyExplainsMarketAnalysis-Visual Analysis
- StockCharts.com
- Technical Analysis of the Financial Markets
- The Visual Investor
- VectorVest, Inc.
- Executive Premier Workshop
- One-Day Options Course
- OptionsPro
- Retirement Income Workshop
- Sure-Fire Trading Systems (VectorVest, Inc.)
- Trading as a Business Workshop
- VectorVest 7 EOD
- VectorVest 7 RealTime/IntraDay
- VectorVest AutoTester
- VectorVest Educational Services
- VectorVest OnLine
- VectorVest Options Analyzer
- VectorVest ProGraphics v6.0
- VectorVest ProTrader 7
- VectorVest RealTime Derby Tool
- VectorVest Simulator
- VectorVest Variator
- VectorVest Watchdog
