HOT TOPICS LIST
- MACD
- Fibonacci
- RSI
- Gann
- ADXR
- Stochastics
- Volume
- Triangles
- Futures
- Cycles
- Volatility
- ZIGZAG
- MESA
- Retracement
- Aroon
INDICATORS LIST
LIST OF TOPICS
PRINT THIS ARTICLE
by Mike Carr, CMT
Warren Buffett recently announced a large purchase of IBM. The chart shows he bought the stock on dips.
Position: Buy
Mike Carr, CMT
Mike Carr, CMT, is a member of the Market Technicians Association, and editor of the MTA's newsletter, Technically Speaking. He is also the author of "Smarter Investing in Any Economy: The Definitive Guide to Relative Strength Investing," and "Conquering the Divide: How to Use Economic Indicators to Catch Stock Market Trends."
PRINT THIS ARTICLE
REL. STR COMPARATIVE
Does Buffett Use Technical Analysis?
11/17/11 08:27:04 AMby Mike Carr, CMT
Warren Buffett recently announced a large purchase of IBM. The chart shows he bought the stock on dips.
Position: Buy
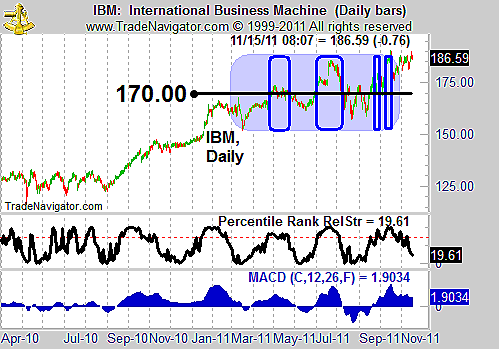
| Through Berkshire Hathaway, Warren Buffett bought about $10 billion worth of stock in IBM. He now owns about 5.5% of the company, and a Berkshire official was quoted as saying that they got the stock at an average price near $170 a share. Buying seems to have started in March, according to Buffett's comments, and was concluded early this quarter. With so much information, we can look at the chart for clues as to how Buffett buys. The subject of what he buys has been covered in many books, and the truth is no one really knows what he looks for. IBM is a brand name, large-cap stock with steady, double-digit earnings growth. |
| In Figure 1, we have highlighted the time frame when Buffett was buying. We can see that the $170 level represents a technical breakout. Relative strength shows that there was strong buying followed by relatively weak demand for the stock. Since Buffett acquired his position near the middle of the price range, it is likely he was buying on dips. His initial purchases likely came near the March lows, and his buying provided support to price in the following months. |

|
| FIGURE 1: IBM, DAILY. IBM shows a great deal of volatility during the period that Buffett was buying. |
| Graphic provided by: Trade Navigator. |
| |
| Rectangles in Figure 1 indicate the periods when relative strength was greater than 70. This may be showing Buffett's buying pattern. After pushing the price up with large purchases, he waited for a pullback before adding to his position. The moving average convergence/divergence (MACD) was generally bullish throughout this period but seems to be duplicating the information available from relative strength. |
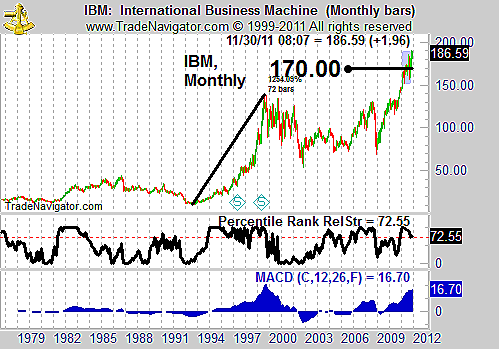
| The monthly chart of IBM (Figure 2) shows that Buffett bought after IBM was reaching all-time highs. This may seem to be in contrast with his value philosophy, but IBM was trading with a price/earnings (P/E) ratio below the market average even after the breakout. |

|
| FIGURE 2: IBM, MONTHLY. IBM delivered a gain of more 1,200% in the mid-1990s. |
| Graphic provided by: Trade Navigator. |
| |
| IBM was once a big stock-market winner, and Buffett obviously thinks it can repeat that feat. From IBM's chart, we can see that Buffett is an excellent trader in addition to being a master of stock selection. He patiently acquired his position without causing a big gain in the price. IBM may be a value stock, but it is also a strong stock on the weekly and monthly charts. This helps dispel the idea that value means low-priced and beaten down. Buffett's purchase seems to show that he believes value and relative strength are compatible. |
Mike Carr, CMT, is a member of the Market Technicians Association, and editor of the MTA's newsletter, Technically Speaking. He is also the author of "Smarter Investing in Any Economy: The Definitive Guide to Relative Strength Investing," and "Conquering the Divide: How to Use Economic Indicators to Catch Stock Market Trends."
| Website: | www.moneynews.com/blogs/MichaelCarr/id-73 |
| E-mail address: | marketstrategist@gmail.com |
Click here for more information about our publications!
PRINT THIS ARTICLE

Request Information From Our Sponsors
- StockCharts.com, Inc.
- Candle Patterns
- Candlestick Charting Explained
- Intermarket Technical Analysis
- John Murphy on Chart Analysis
- John Murphy's Chart Pattern Recognition
- John Murphy's Market Message
- MurphyExplainsMarketAnalysis-Intermarket Analysis
- MurphyExplainsMarketAnalysis-Visual Analysis
- StockCharts.com
- Technical Analysis of the Financial Markets
- The Visual Investor
- VectorVest, Inc.
- Executive Premier Workshop
- One-Day Options Course
- OptionsPro
- Retirement Income Workshop
- Sure-Fire Trading Systems (VectorVest, Inc.)
- Trading as a Business Workshop
- VectorVest 7 EOD
- VectorVest 7 RealTime/IntraDay
- VectorVest AutoTester
- VectorVest Educational Services
- VectorVest OnLine
- VectorVest Options Analyzer
- VectorVest ProGraphics v6.0
- VectorVest ProTrader 7
- VectorVest RealTime Derby Tool
- VectorVest Simulator
- VectorVest Variator
- VectorVest Watchdog
