HOT TOPICS LIST
- MACD
- Fibonacci
- RSI
- Gann
- ADXR
- Stochastics
- Volume
- Triangles
- Futures
- Cycles
- Volatility
- ZIGZAG
- MESA
- Retracement
- Aroon
INDICATORS LIST
LIST OF TOPICS
PRINT THIS ARTICLE
by Koos van der Merwe
With the indexes falling out of bed as Italy joins Greece in the European uncertainty, it is always gratifying to find a stock going against the tumbling trend.
Position: Sell
Koos van der Merwe
Has been a technical analyst since 1969, and has worked as a futures and options trader with First Financial Futures in Johannesburg, South Africa.
PRINT THIS ARTICLE
DOUBLE BOTTOMS
Riding Along With Canadian Railways
11/10/11 08:35:16 AMby Koos van der Merwe
With the indexes falling out of bed as Italy joins Greece in the European uncertainty, it is always gratifying to find a stock going against the tumbling trend.
Position: Sell
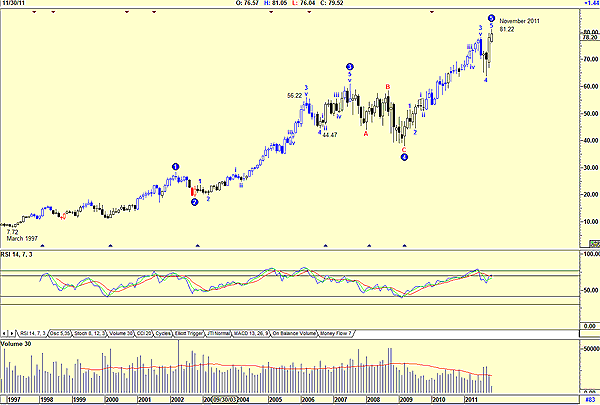
| The news reports about Canadian Railways (CNR) have all been positive, and perhaps that is why the stock price is rising. Figure 1, the monthly chart, shows how the share price has risen from a low of $7.72 on March 1997 to its present price of $81.22. |

|
| FIGURE 1: CNR, MONTHLY |
| Graphic provided by: AdvancedGET. |
| |
| An Elliott wave count suggests that the share price has completed wave 5 and should now fall to the fourth wave of lesser degree, somewhere between $44.47 and $56.22. This is confirmed by the relative strength index (RSI), which has suggested a sell signal. Volume has been below average as wave 5 developed, suggesting weakness ahead. Concluding that a fall in price is on the cards, I looked to a daily chart (Figure 2). |

|
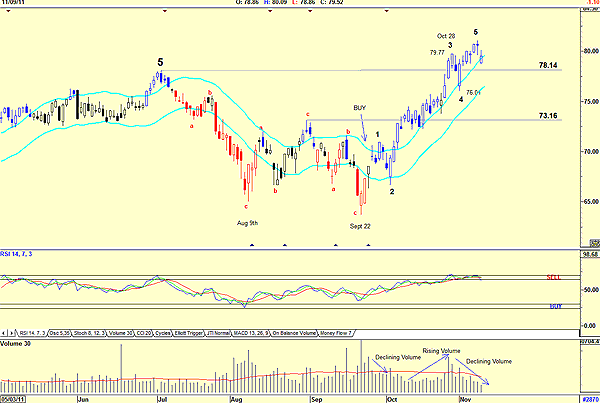
| FIGURE 2: CNR, DAILY |
| Graphic provided by: AdvancedGET. |
| |
| The daily chart shows the following: 1. A double bottom formed on September 22. The share price then rose to give a buy on the JM internal band indicator on September 28 in a wave 1. 2. The RSI suggested a buy signal on August 9, the first low of the double bottom. 3. The price then fell in a wave 2 to test the lower JM band but did not break it, giving a short sale. 4. The price then rose on rising volume, a sign of strength into wave 3, topping out on October 28 at $79.77. It then fell in a wave 4 on falling volume, suggesting strength. The price then rose into wave 5, but volume continued falling, suggesting further weakness ahead. Canadian Railways is a share to watch, simply because it is not reacting to all the negativity in the stock market. The share price is suggesting a correction is on the cards, but this will just offer the opportunity to buy at a much more attractive price. I have suggested two targets, $78.14 and $73.16, both being pivot points, but neither may be the entry level. The RSI, which is overbought at the moment, may suggest a better entry level as it moves into oversold levels. |
Has been a technical analyst since 1969, and has worked as a futures and options trader with First Financial Futures in Johannesburg, South Africa.
| Address: | 3256 West 24th Ave |
| Vancouver, BC | |
| Phone # for sales: | 6042634214 |
| E-mail address: | petroosp@gmail.com |
Click here for more information about our publications!
PRINT THIS ARTICLE

Request Information From Our Sponsors
- VectorVest, Inc.
- Executive Premier Workshop
- One-Day Options Course
- OptionsPro
- Retirement Income Workshop
- Sure-Fire Trading Systems (VectorVest, Inc.)
- Trading as a Business Workshop
- VectorVest 7 EOD
- VectorVest 7 RealTime/IntraDay
- VectorVest AutoTester
- VectorVest Educational Services
- VectorVest OnLine
- VectorVest Options Analyzer
- VectorVest ProGraphics v6.0
- VectorVest ProTrader 7
- VectorVest RealTime Derby Tool
- VectorVest Simulator
- VectorVest Variator
- VectorVest Watchdog
- StockCharts.com, Inc.
- Candle Patterns
- Candlestick Charting Explained
- Intermarket Technical Analysis
- John Murphy on Chart Analysis
- John Murphy's Chart Pattern Recognition
- John Murphy's Market Message
- MurphyExplainsMarketAnalysis-Intermarket Analysis
- MurphyExplainsMarketAnalysis-Visual Analysis
- StockCharts.com
- Technical Analysis of the Financial Markets
- The Visual Investor
