HOT TOPICS LIST
- MACD
- Fibonacci
- RSI
- Gann
- ADXR
- Stochastics
- Volume
- Triangles
- Futures
- Cycles
- Volatility
- ZIGZAG
- MESA
- Retracement
- Aroon
INDICATORS LIST
LIST OF TOPICS
PRINT THIS ARTICLE
by Mike Carr, CMT
HANS offers an example of one of the all-time great stocks with a gain of more than 17,000% in less than 10 years, an annual rate of return of more than 75%.
Position: Buy
Mike Carr, CMT
Mike Carr, CMT, is a member of the Market Technicians Association, and editor of the MTA's newsletter, Technically Speaking. He is also the author of "Smarter Investing in Any Economy: The Definitive Guide to Relative Strength Investing," and "Conquering the Divide: How to Use Economic Indicators to Catch Stock Market Trends."
PRINT THIS ARTICLE
STOCHASTICS
Hansen Natural Another 10-Bagger
11/09/11 02:07:14 PMby Mike Carr, CMT
HANS offers an example of one of the all-time great stocks with a gain of more than 17,000% in less than 10 years, an annual rate of return of more than 75%.
Position: Buy
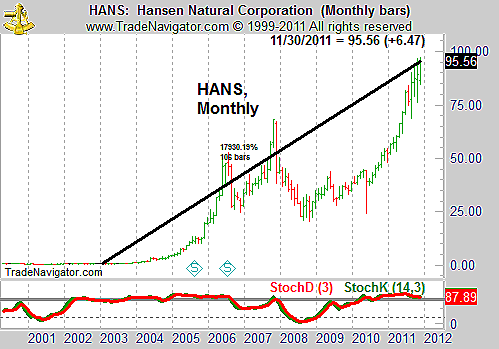
| Hansen Natural (HANS) makes natural sodas and energy drinks. Since the beginning of 2003, the stock has gained more than 17,900% (Figure 1). But that is not to say it didn't have any downward moves. Like other big winners, the chart shows times when the stock dropped by a large amount. |

|
| FIGURE 1: HANS, MONTHLY. The stochastics indicator shows that this long-term winner spent most of the time overbought, and many traders would miss the gains waiting for a traditional entry signal. |
| Graphic provided by: Trade Navigator. |
| |
| If you look at the monthly chart of HANS in Figure 1, you will see that in 2006, the stock fell by more than 50% after gaining nearly 10,000% in only three years. Even long-term, dedicated buy and hold investors would be tempted to sell after seeing such a large gain and experiencing such a steep decline. This loss occurred in a generally rising stock market, making it even harder to argue that the stock would continue delivering big gains to investors. |
| In the 2008 bear market, the loss in HANS totaled 70%. From the March 2009 bottom, HANS is up about 375%. The stochastic indicator in the subchart below the price chart did indicate a buy signal from an oversold level on the monthly chart at that bottom. |
| Using the moving average convergence/divergence (MACD) on a monthly chart, you would not have had a chance to get into this position until 2009, and that would been a losing trade. The system would eventually make money, but it would not be nearly as much as a buy & hold investor. Like with many big winners, there was no pullback in the momentum indicators after the stock started moving higher. |

|
| |
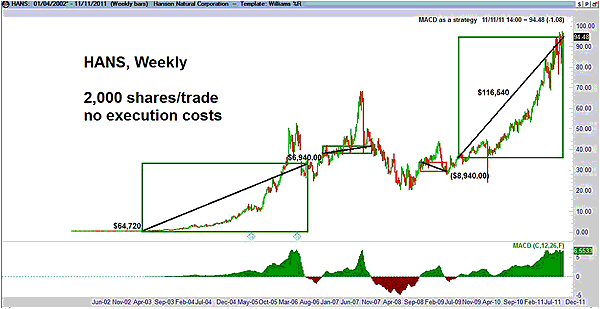
| However, if you used a shorter time frame such as the weekly chart (Figure 2), you could have turned $1,000 into about $130,000 using the MACD and being long only. In order to do so, you would have to know that HANS would be a big winner over time. Its industry is boring and unlikely to get anyone's attention. Finding the 10-baggers of the future is a challenging task. It is worth spending more time looking at what they have in common. |
Mike Carr, CMT, is a member of the Market Technicians Association, and editor of the MTA's newsletter, Technically Speaking. He is also the author of "Smarter Investing in Any Economy: The Definitive Guide to Relative Strength Investing," and "Conquering the Divide: How to Use Economic Indicators to Catch Stock Market Trends."
| Website: | www.moneynews.com/blogs/MichaelCarr/id-73 |
| E-mail address: | marketstrategist@gmail.com |
Click here for more information about our publications!
Comments
Date: 11/10/11Rank: 1Comment: Totally misleading headline about 10 bagger. People don t care about a past 10 bagger. What a sorry article, utterly waste of my time.

Request Information From Our Sponsors
- StockCharts.com, Inc.
- Candle Patterns
- Candlestick Charting Explained
- Intermarket Technical Analysis
- John Murphy on Chart Analysis
- John Murphy's Chart Pattern Recognition
- John Murphy's Market Message
- MurphyExplainsMarketAnalysis-Intermarket Analysis
- MurphyExplainsMarketAnalysis-Visual Analysis
- StockCharts.com
- Technical Analysis of the Financial Markets
- The Visual Investor
- VectorVest, Inc.
- Executive Premier Workshop
- One-Day Options Course
- OptionsPro
- Retirement Income Workshop
- Sure-Fire Trading Systems (VectorVest, Inc.)
- Trading as a Business Workshop
- VectorVest 7 EOD
- VectorVest 7 RealTime/IntraDay
- VectorVest AutoTester
- VectorVest Educational Services
- VectorVest OnLine
- VectorVest Options Analyzer
- VectorVest ProGraphics v6.0
- VectorVest ProTrader 7
- VectorVest RealTime Derby Tool
- VectorVest Simulator
- VectorVest Variator
- VectorVest Watchdog
