HOT TOPICS LIST
- MACD
- Fibonacci
- RSI
- Gann
- ADXR
- Stochastics
- Volume
- Triangles
- Futures
- Cycles
- Volatility
- ZIGZAG
- MESA
- Retracement
- Aroon
INDICATORS LIST
LIST OF TOPICS
PRINT THIS ARTICLE
by David Penn
When the Fed begins to tighten, Industrials and Basic Materials are often hit hardest.
Position: N/A
David Penn
Technical Writer for Technical Analysis of STOCKS & COMMODITIES magazine, Working-Money.com, and Traders.com Advantage.
PRINT THIS ARTICLE
CCI
Commodity Channel Index
05/07/02 11:07:23 AMby David Penn
When the Fed begins to tighten, Industrials and Basic Materials are often hit hardest.
Position: N/A
| It's hard to pick on stock market sectors for underperforming in today's market. With the exception of consumer staples and healthcare, few areas of the economy are doing well in the current environment. What is worse is that with short-term interest rates at historic lows, higher short-term rates are inevitable. And higher short-term interest rates, historically speaking, have been terrible for stocks. I wrote recently ("Waiting for the Fed," Working-Money.com) about a Barron's piece that noted data from Morgan Stanley that pointed to some sectors of the economy that are more ill-equipped to deal with higher short-term interest rates than others. This tells me it might be worthwhile to take a technical look at some of these sectors-- industrials and basic materials-- through a technical lens, to find out whether this doom-outlook is appropriate. What is most ironic about these two sectors is that they are among the three (technology is the third) that tend to outperform others in the three months leading up to the first initial tightening by the Fed. |
| Although called the "Commodity Channel Index" when originally developed by Donald Lambert, the CCI can be used on stocks and indexes, as well as commodities. Like a number of effective indicators, the CCI works by measuring the distance prices deviate from a statistical mean. Higher values in the CCI suggest, appropriately enough, that prices are abnormally high, while lower CCI values indicate that prices are abnormally low. The typical period, or time frame, for the CCI is 14 days and will be the period-length used to look at the industrial and basic materials sectors indexes. One more thing about the CCI: the flexibility in the indicator is such that the Commodity Channel Index can be used as an oscillator-- measuring "overbought" and "oversold" conditions-- or for divergences from price action. In the former case, the CCI generally moves between positive and negative 100, with values above 100 meaning overbought and values below 100 meaning oversold. To use the CCI to check for divergences-- as the Commodity Channel Index will be used here-- note where new highs and new lows in price action are confirmed (or not confirmed) by upward or downward movement in the CCI. |

|
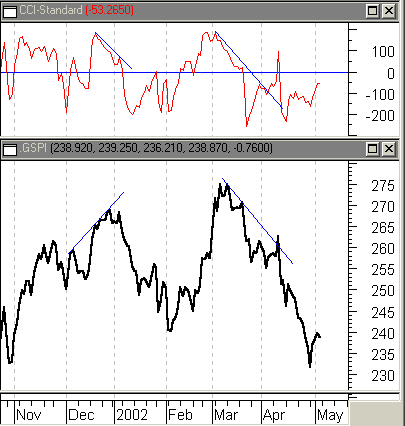
| Figure 1: After a bearish divergence in the fall of 2001, the CCI had led the Industrials down in the spring of 2002. |
| Graphic provided by: MetaStock. |
| |
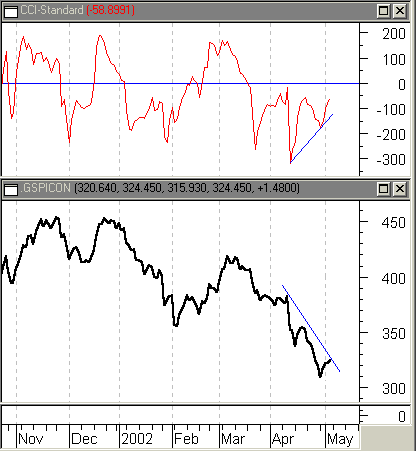
The first chart shows the performance of the S&P Industrial Sector Index. The S&P Industrials have struggled along with the rest of the market, with industrial conglomerates dragging the sector down in spite of scattered strength in aerospace and defense. Note the downwardly sloping CCI value in late December 2001, which occurs at the same time that the S&P Industrials Index is moving upward. This is a classic example of a bearish price divergence-- when an indicator is moving bearishly while the underlying prices continue to look bullish. This particular divergence hinted at weakness in the sector going into 2002. In the wake of the January correction that ensued, the CCI and the S&P Industrial Index moved upward together in February and, unfortunately for industrial bulls, back down together in March and April. Nevertheless, those using the CCI would have taken comfort in the way the indicator confirmed the spring moves of the Index.  Figure 2: A positive divergence suggests that industrial conglomerate stocks may be nearing a bottom. There is actually a positive divergence in the chart of the industrial conglomerates of the S&P. Note how the CCI moves up sharply in mid-April, at the same time that the index for the industrial conglomerates is moving downward. While it is dangerous to try and catch a falling knife, in other words, trying to pick a bottom in a falling market, the fact that the CCI is diverging positively from the S&P industrial conglomerates index suggests that the "easy money" on the short side of these stocks may be coming to an end. |
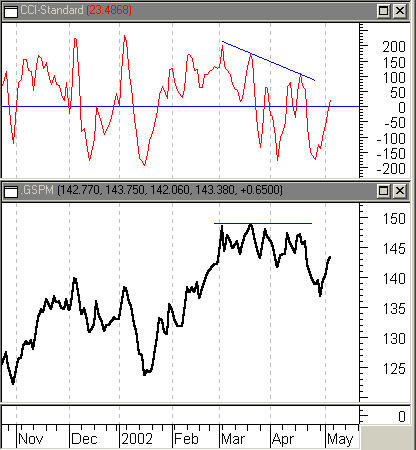
 Figure 3: The April break in basic materials stocks was anticipated by the falling CCI. The third chart takes a look at the S&P Basic Materials Sector Index. The S&P Basic Materials Index showed more strength this spring than the Industrials-- although much of this strength may be attributed to the performance of the gold industry, which is up some 30+% year-to-date. All the same, the Commodity Channel Index began to show some weakness in Basic Materials in late March, when it began making lower highs (and actually plunged beneath the zero line, as well). Basic Materials held on into mid-April, during which time the CCI actually moved back up. However, the bearish divergence that began developing in March (the CCI was moving lower while the Basic Materials Index was flat) accurately anticipated the weakness that would soon develop. |
| The formula for the CCI is more complex than the average indicator. For one, high, low and closing prices are added together to form a "typical price." A moving average of these typical prices is then computed. The following steps are where some of the complexity lies, which involve finding the difference between the typical prices and the moving average of typical prices over time, setting up a moving average of the absolute value of those differences, applying a multiplier to this moving average and a few other arithmetic maneuvers (subtract the moving average of typical prices from the typical price and divide this figure by the moving average of the absolute value of the differences times 0.015--the multiplier) to arrive at the actual indicator. Fortunately, most charting software programs and Internet-based charting sites feature CCI in both 14-day default and customized modes. |
Technical Writer for Technical Analysis of STOCKS & COMMODITIES magazine, Working-Money.com, and Traders.com Advantage.
| Title: | Technical Writer |
| Company: | Technical Analysis, Inc. |
| Address: | 4757 California Avenue SW |
| Seattle, WA 98116 | |
| Phone # for sales: | 206 938 0570 |
| Fax: | 206 938 1307 |
| Website: | www.Traders.com |
| E-mail address: | DPenn@traders.com |
Traders' Resource Links | |
| Charting the Stock Market: The Wyckoff Method -- Books | |
| Working-Money.com -- Online Trading Services | |
| Traders.com Advantage -- Online Trading Services | |
| Technical Analysis of Stocks & Commodities -- Publications and Newsletters | |
| Working Money, at Working-Money.com -- Publications and Newsletters | |
| Traders.com Advantage -- Publications and Newsletters | |
| Professional Traders Starter Kit -- Software | |
Click here for more information about our publications!
Comments
Date: 05/07/02Rank: 5Comment:
Date: 05/14/02Rank: 5Comment:

Request Information From Our Sponsors
- StockCharts.com, Inc.
- Candle Patterns
- Candlestick Charting Explained
- Intermarket Technical Analysis
- John Murphy on Chart Analysis
- John Murphy's Chart Pattern Recognition
- John Murphy's Market Message
- MurphyExplainsMarketAnalysis-Intermarket Analysis
- MurphyExplainsMarketAnalysis-Visual Analysis
- StockCharts.com
- Technical Analysis of the Financial Markets
- The Visual Investor
- VectorVest, Inc.
- Executive Premier Workshop
- One-Day Options Course
- OptionsPro
- Retirement Income Workshop
- Sure-Fire Trading Systems (VectorVest, Inc.)
- Trading as a Business Workshop
- VectorVest 7 EOD
- VectorVest 7 RealTime/IntraDay
- VectorVest AutoTester
- VectorVest Educational Services
- VectorVest OnLine
- VectorVest Options Analyzer
- VectorVest ProGraphics v6.0
- VectorVest ProTrader 7
- VectorVest RealTime Derby Tool
- VectorVest Simulator
- VectorVest Variator
- VectorVest Watchdog
