HOT TOPICS LIST
- MACD
- Fibonacci
- RSI
- Gann
- ADXR
- Stochastics
- Volume
- Triangles
- Futures
- Cycles
- Volatility
- ZIGZAG
- MESA
- Retracement
- Aroon
INDICATORS LIST
LIST OF TOPICS
PRINT THIS ARTICLE
by Koos van der Merwe
With the market as volatile as it is at the moment, investors are always looking for interest. Take a look at this stock.
Position: Accumulate
Koos van der Merwe
Has been a technical analyst since 1969, and has worked as a futures and options trader with First Financial Futures in Johannesburg, South Africa.
PRINT THIS ARTICLE
MOVING AVERAGES
Looking For Interest? Look At LBS
11/07/11 11:23:57 AMby Koos van der Merwe
With the market as volatile as it is at the moment, investors are always looking for interest. Take a look at this stock.
Position: Accumulate
| The Brompton Group is a leading provider of TSX-listed funds with approximately $1.3 billion in assets under management. One of their managed funds, Life and Banc Split Corp. (LBS), at the moment is giving a 6.1% yield. Does that mean now is a good time to buy? |

|
| FIGURE 1: LBS, WEEKLY |
| Graphic provided by: AdvancedGET. |
| |
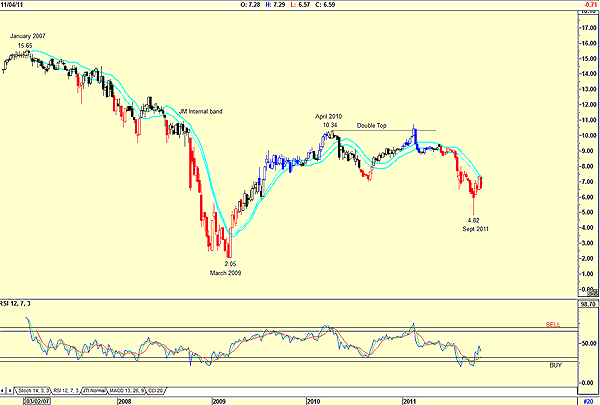
| The weekly chart in Figure 1 shows how the price dropped from a high of $15.65 in January 2007 to a low of $2.05 in March 2009. The price then rose to $10.34 by April 2010, forming a double top, before falling to a low of $4.82 by September 2011. The relative strength index (RSI) was excellent in giving buy and sell signals. At the moment, it is suggesting that we could consider buying the stock. The JM internal band indicator, a far more conservative indicator, is telling us to wait. |

|
| FIGURE 2: LBS, DAILY |
| Graphic provided by: AdvancedGET. |
| |
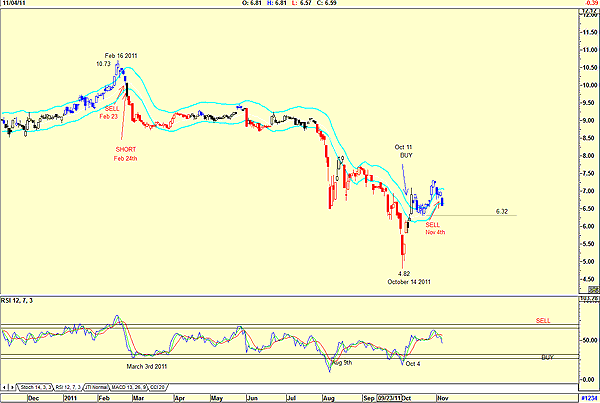
| On the daily chart of LBS in Figure 2, you can see how the share price dropped from a high of $10.73 on February 16, giving a JM close position signal on February 23 and a short on February 24, along with the RSI sell signal. Since that date, although the RSI gave a buy signal on March 3 and again on August 9, neither signal was confirmed by the JM internal band indicator. On October 4, the RSI gave a third buy signal, confirmed by a buy signal on the JM internal band indicator on October 11. However, on November 4, the fall in price triggered a sell signal (close open position) by breaking below the 14-period simple moving average. What would you do now? I would now look for the share price to test the $6.32 resistance level before considering a possible buy that would be confirmed when a buy signal is given on the JM internal band. The RSI is still suggesting a positive move, but we could err on the side of caution, especially in today's volatile market. LBS is a dividend-paying share that we should place on our watchlist. When the market starts recovering, the growth, plus a comfortable dividend, will be worth it. |
Has been a technical analyst since 1969, and has worked as a futures and options trader with First Financial Futures in Johannesburg, South Africa.
| Address: | 3256 West 24th Ave |
| Vancouver, BC | |
| Phone # for sales: | 6042634214 |
| E-mail address: | petroosp@gmail.com |
Click here for more information about our publications!
PRINT THIS ARTICLE

Request Information From Our Sponsors
- StockCharts.com, Inc.
- Candle Patterns
- Candlestick Charting Explained
- Intermarket Technical Analysis
- John Murphy on Chart Analysis
- John Murphy's Chart Pattern Recognition
- John Murphy's Market Message
- MurphyExplainsMarketAnalysis-Intermarket Analysis
- MurphyExplainsMarketAnalysis-Visual Analysis
- StockCharts.com
- Technical Analysis of the Financial Markets
- The Visual Investor
- VectorVest, Inc.
- Executive Premier Workshop
- One-Day Options Course
- OptionsPro
- Retirement Income Workshop
- Sure-Fire Trading Systems (VectorVest, Inc.)
- Trading as a Business Workshop
- VectorVest 7 EOD
- VectorVest 7 RealTime/IntraDay
- VectorVest AutoTester
- VectorVest Educational Services
- VectorVest OnLine
- VectorVest Options Analyzer
- VectorVest ProGraphics v6.0
- VectorVest ProTrader 7
- VectorVest RealTime Derby Tool
- VectorVest Simulator
- VectorVest Variator
- VectorVest Watchdog
