

HOT TOPICS LIST
- MACD
- Fibonacci
- RSI
- Gann
- ADXR
- Stochastics
- Volume
- Triangles
- Futures
- Cycles
- Volatility
- ZIGZAG
- MESA
- Retracement
- Aroon
INDICATORS LIST
LIST OF TOPICS
PRINT THIS ARTICLE
by Mike Carr, CMT
Simple technical tools can help traders spot the trend.
Position: Buy
Mike Carr, CMT
Mike Carr, CMT, is a member of the Market Technicians Association, and editor of the MTA's newsletter, Technically Speaking. He is also the author of "Smarter Investing in Any Economy: The Definitive Guide to Relative Strength Investing," and "Conquering the Divide: How to Use Economic Indicators to Catch Stock Market Trends."
PRINT THIS ARTICLE
RATE OF CHANGE
S&P 500 Holds Support
11/03/11 08:53:04 AMby Mike Carr, CMT
Simple technical tools can help traders spot the trend.
Position: Buy
| Traders and analysts are debating whether stocks are in a bull or bear market. New traders, and even many old pros, often forget that the market doesn't care about their opinions. Simple chart tools can help traders stay on the right side of the market, and the right side is simply the profitable side. |
| Stocks declined sharply in July and August. They then formed a wide base over the next several weeks. Traders often see what they want to see in charts, using them to confirm their opinion rather than interpreting the action in an objective manner. Being bullish, the base that formed over 10 weeks appears to be a rectangle with a bear trap at the low in early October. Bears see a rectangle consolidation and the recent large gains are a bull trap. |
| If we ignore patterns, there is a simple resistance at 1210 that stopped three price advances (Figure 1). That line has now held as support. |
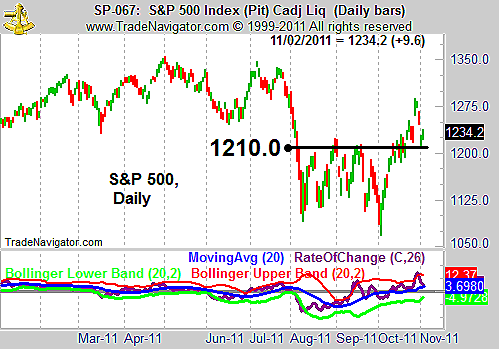
|
| FIGURE 1: S&P 500, DAILY. Support and momentum seem to indicate the trend is up for stocks. |
| Graphic provided by: Trade Navigator. |
| |
| The rate of change indicator showed a bullish divergence as the October low was reached and has continued higher, confirming the price trend. News from Europe can certainly move markets day to day, but the weight of the evidence shows that the intermediate-term trend seems to be higher in stocks. |
| Prices moved to the first target from the rectangle pattern near 1300. The width of a pattern can always be used to find a price target after price breaks out of the pattern. After hitting the target on very high momentum, a pullback is expected to occur. The next move higher could take prices to about 1320 based on the pattern, or 1350, based on resistance. |
Mike Carr, CMT, is a member of the Market Technicians Association, and editor of the MTA's newsletter, Technically Speaking. He is also the author of "Smarter Investing in Any Economy: The Definitive Guide to Relative Strength Investing," and "Conquering the Divide: How to Use Economic Indicators to Catch Stock Market Trends."
| Website: | www.moneynews.com/blogs/MichaelCarr/id-73 |
| E-mail address: | marketstrategist@gmail.com |
Click here for more information about our publications!
PRINT THIS ARTICLE

Request Information From Our Sponsors
- VectorVest, Inc.
- Executive Premier Workshop
- One-Day Options Course
- OptionsPro
- Retirement Income Workshop
- Sure-Fire Trading Systems (VectorVest, Inc.)
- Trading as a Business Workshop
- VectorVest 7 EOD
- VectorVest 7 RealTime/IntraDay
- VectorVest AutoTester
- VectorVest Educational Services
- VectorVest OnLine
- VectorVest Options Analyzer
- VectorVest ProGraphics v6.0
- VectorVest ProTrader 7
- VectorVest RealTime Derby Tool
- VectorVest Simulator
- VectorVest Variator
- VectorVest Watchdog
- StockCharts.com, Inc.
- Candle Patterns
- Candlestick Charting Explained
- Intermarket Technical Analysis
- John Murphy on Chart Analysis
- John Murphy's Chart Pattern Recognition
- John Murphy's Market Message
- MurphyExplainsMarketAnalysis-Intermarket Analysis
- MurphyExplainsMarketAnalysis-Visual Analysis
- StockCharts.com
- Technical Analysis of the Financial Markets
- The Visual Investor