HOT TOPICS LIST
- MACD
- Fibonacci
- RSI
- Gann
- ADXR
- Stochastics
- Volume
- Triangles
- Futures
- Cycles
- Volatility
- ZIGZAG
- MESA
- Retracement
- Aroon
INDICATORS LIST
LIST OF TOPICS
PRINT THIS ARTICLE
by Koos van der Merwe
Is it time to take a second look?
Position: Sell
Koos van der Merwe
Has been a technical analyst since 1969, and has worked as a futures and options trader with First Financial Futures in Johannesburg, South Africa.
PRINT THIS ARTICLE
CANDLESTICK CHARTING
American Tower's Double Bottom
11/03/11 08:48:51 AMby Koos van der Merwe
Is it time to take a second look?
Position: Sell
| Developments in Greece is once again affecting the market in the United States and the world. So once again stocks tumble on euro uncertainty, even though the economy of the US is recovering, albeit slowly. With a slow but sure recovery, is it time to take a second look? |

|
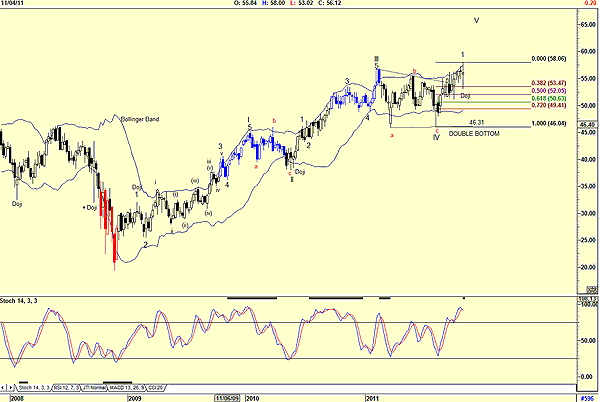
| FIGURE 1: AMT, DAILY |
| Graphic provided by: AdvancedGET. |
| |
| Figure 1 is a daily chart of American Tower (AMT) and shows an Elliott wave count that suggests that the stock could be starting a wave 2 down of a wave V up. This is confirmed by the stochastic indicator, which is at overbought levels and suggesting weakness ahead. The share price also formed a candlestick doji formation. This is an important one-day formation formed when the open and close of a day's trading session are the same, or very close, and an upper or lower shadow or both exist. A doji does suggest a reversal in trend. However, there are occasions when a doji formation may occur and the market does not change direction. This usually happens when the open and close are not equal, as shown on the chart by the doji I have labeled with an asterisk. The doji currently shown has the open and close very close together, suggesting that a reversal has a good chance of occurring. Finally, do note that the doji upper shadow is above the Bollinger Band, a further suggestion of weakness ahead. We could expect the share price to retest the double bottom at $46.31, but I would rather look to a Fibonacci retracement level somewhere in the region of $49.41 (a 72% retracement) and $50.63 (a 61.8% retracement.) AMT is a share we should place on our watchlists for a future buy. Is it time to do so? Not yet, but soon. |
Has been a technical analyst since 1969, and has worked as a futures and options trader with First Financial Futures in Johannesburg, South Africa.
| Address: | 3256 West 24th Ave |
| Vancouver, BC | |
| Phone # for sales: | 6042634214 |
| E-mail address: | petroosp@gmail.com |
Click here for more information about our publications!
PRINT THIS ARTICLE

Request Information From Our Sponsors
- VectorVest, Inc.
- Executive Premier Workshop
- One-Day Options Course
- OptionsPro
- Retirement Income Workshop
- Sure-Fire Trading Systems (VectorVest, Inc.)
- Trading as a Business Workshop
- VectorVest 7 EOD
- VectorVest 7 RealTime/IntraDay
- VectorVest AutoTester
- VectorVest Educational Services
- VectorVest OnLine
- VectorVest Options Analyzer
- VectorVest ProGraphics v6.0
- VectorVest ProTrader 7
- VectorVest RealTime Derby Tool
- VectorVest Simulator
- VectorVest Variator
- VectorVest Watchdog
- StockCharts.com, Inc.
- Candle Patterns
- Candlestick Charting Explained
- Intermarket Technical Analysis
- John Murphy on Chart Analysis
- John Murphy's Chart Pattern Recognition
- John Murphy's Market Message
- MurphyExplainsMarketAnalysis-Intermarket Analysis
- MurphyExplainsMarketAnalysis-Visual Analysis
- StockCharts.com
- Technical Analysis of the Financial Markets
- The Visual Investor
