HOT TOPICS LIST
- MACD
- Fibonacci
- RSI
- Gann
- ADXR
- Stochastics
- Volume
- Triangles
- Futures
- Cycles
- Volatility
- ZIGZAG
- MESA
- Retracement
- Aroon
INDICATORS LIST
LIST OF TOPICS
PRINT THIS ARTICLE
by Gary Grosschadl
Chart and recent news suggest a turnaround in the making for Canada's dominant airline.
Position: N/A
Gary Grosschadl
Independent Canadian equities trader and technical analyst based in Peterborough
Ontario, Canada.
PRINT THIS ARTICLE
CHART ANALYSIS
Air Canada Taking Off Despite Market's Storm Front
05/06/02 01:04:54 PMby Gary Grosschadl
Chart and recent news suggest a turnaround in the making for Canada's dominant airline.
Position: N/A
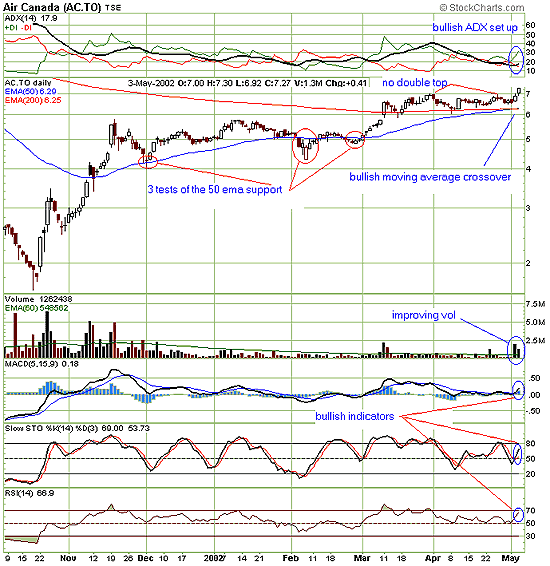
| Air Canada followed the general flight path of many other airline stocks but now looks more encouraging by virtue of its chart. The chart's technicals may be a step ahead of their fundamentals and that is improving results. I see several encouraging indicators that warrant a closer look. |
| Two important moving averages that traders and fund managers watch are the 200- and the 50-day exponential moving average (EMA). As the chart shows, back in mid-November AC made a bullish move above its 50-day EMA. After three successful tests of that same EMA support, the stock then broke through the important 200-day EMA barrier. A trading channel then appeared as the stock went into a consolidation period of its bullish thrust. |

|
| Graphic provided by: stockcharts.com. |
| |
| Now the stock has made the first attempt at breaking out of the trading range on increased volume. Note that traders may be further encouraged because the danger of a double top seems to be averted. This latest bullish thrust is also reflected in improving MACD, RSI and stochastics. The directional movement indicator (DMI) is now also bullish as the ADX line is between both DIs, with + DI leading. This trend indicator grows more convincing as ADX strengthens above the 20 level, and we need to see more improvement here to confirm the bullish price action. |
| Traders should watch for continued strength by the support of not only the 50- and 200-day EMAs, but of the shorter 20-day EMA. With improving ADX strength, the stock will be supported by its 20-day EMA and even its 10-day EMA in the short term. The stock is trading above its 10- and 20-day EMA (these were omitted from the chart for visual clarity). |
| Short term traders will want to see the stock keep trading above the 10- and 20-day EMAs, while longer term traders can keep a wary eye on the 50- and 200-day EMAs. A breach of 200-day EMA support may lead to a test of support at $6. Prudent traders may want to have a stop-loss just below the 200-day EMA support, currently $6.26. |
Independent Canadian equities trader and technical analyst based in Peterborough
Ontario, Canada.
| Website: | www.whatsonsale.ca/financial.html |
| E-mail address: | gwg7@sympatico.ca |
Click here for more information about our publications!
Comments
Date: 05/07/02Rank: 5Comment:

Request Information From Our Sponsors
- StockCharts.com, Inc.
- Candle Patterns
- Candlestick Charting Explained
- Intermarket Technical Analysis
- John Murphy on Chart Analysis
- John Murphy's Chart Pattern Recognition
- John Murphy's Market Message
- MurphyExplainsMarketAnalysis-Intermarket Analysis
- MurphyExplainsMarketAnalysis-Visual Analysis
- StockCharts.com
- Technical Analysis of the Financial Markets
- The Visual Investor
- VectorVest, Inc.
- Executive Premier Workshop
- One-Day Options Course
- OptionsPro
- Retirement Income Workshop
- Sure-Fire Trading Systems (VectorVest, Inc.)
- Trading as a Business Workshop
- VectorVest 7 EOD
- VectorVest 7 RealTime/IntraDay
- VectorVest AutoTester
- VectorVest Educational Services
- VectorVest OnLine
- VectorVest Options Analyzer
- VectorVest ProGraphics v6.0
- VectorVest ProTrader 7
- VectorVest RealTime Derby Tool
- VectorVest Simulator
- VectorVest Variator
- VectorVest Watchdog
