HOT TOPICS LIST
- MACD
- Fibonacci
- RSI
- Gann
- ADXR
- Stochastics
- Volume
- Triangles
- Futures
- Cycles
- Volatility
- ZIGZAG
- MESA
- Retracement
- Aroon
INDICATORS LIST
LIST OF TOPICS
PRINT THIS ARTICLE
by Mike Carr, CMT
Analyst Peter Lynch noted the really big money comes from finding the biggest potential winners. Are there real-time tools that could help buy winners before they run higher?
Position: Buy
Mike Carr, CMT
Mike Carr, CMT, is a member of the Market Technicians Association, and editor of the MTA's newsletter, Technically Speaking. He is also the author of "Smarter Investing in Any Economy: The Definitive Guide to Relative Strength Investing," and "Conquering the Divide: How to Use Economic Indicators to Catch Stock Market Trends."
PRINT THIS ARTICLE
MACD
Can You Spot A Ten-Bagger In Advance?
11/02/11 09:14:16 AMby Mike Carr, CMT
Analyst Peter Lynch noted the really big money comes from finding the biggest potential winners. Are there real-time tools that could help buy winners before they run higher?
Position: Buy
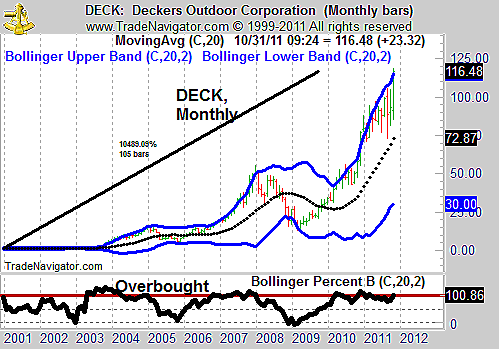
| Deckers Outdoor Corp. (DECK) makes footwear and accessories. It sells shoes, although the brands are often thought of as luxury footwear. UGG, Teva. and Ahnu are among the names designed and sold by Deckers. It's an unspectacular but profitable business. The stock has gained more than 10,000% since the beginning of 2003 (Figure 1). |

|
| FIGURE 1: DECK, MONTHLY. DECK has been a 10-bagger for buy & hold investors, with a 10,489% gain over 8.75 years. |
| Graphic provided by: Trade Navigator. |
| |
| When the stock began its big move, it was overbought and remained so for more than a year. This is seen in the Bollinger Bands, with price above the upper band as the up move began. DECK would be above the upper band more than 27% of the time during the time it took to become a 10-bagger. It dropped below the lower band in only three months. This indicates that the most powerful stocks do not give investors a deeply oversold, low-risk chance to get in. |
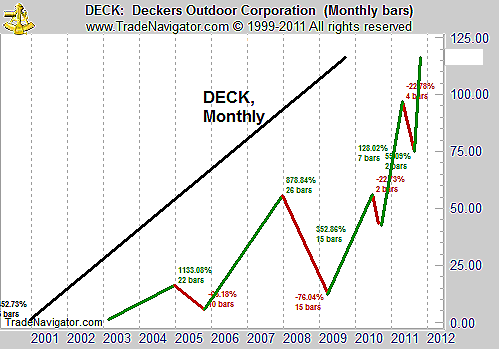
| Figure 2 shows the large swings in the price of DECK were mostly to the upside. There was a decline of 65% in 2005 and a 76% drop in the 2008-09 bear market. Drops like these make it difficult to hold onto a position long enough to get the big gains that Lynch wrote about. In hindsight, we can see they weren't important to the longer-term trend, but in real time, it is unlikely that many traders would sit through such deep drawdowns. |

|
| FIGURE 2: DECK, MONTHLY. Very large price gains were followed by extremely large drawdowns on two occasions. |
| Graphic provided by: Trade Navigator. |
| |
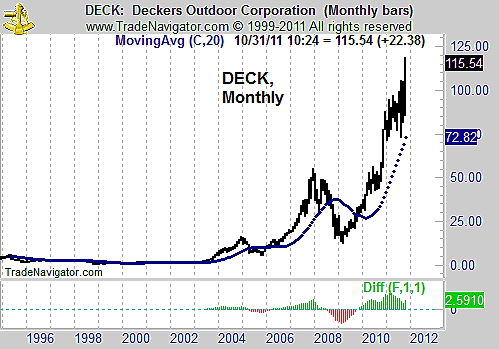
| Using a monthly chart, Figure 3 shows that the moving average convergence/divergence (MACD) would have helped avoid the steepest losses. A simple 20-month moving average is also a useful timing tool on the monthly chart. Either of these simple strategies would have gotten you out after the top and avoided a large part of the drawdowns. |

|
| FIGURE 3: DECK, MONTHLY. The monthly chart shows that sell signals from MACD or a 20-month moving average would help avoid losses. |
| Graphic provided by: Trade Navigator. |
| |
| MACD would have been extremely profitable, delivering a gain of about $60,000 on a $10,000 investment. Buy & hold would have done much better, but this would have beaten the market averages and is a starting point for further study of the 10-baggers. |
Mike Carr, CMT, is a member of the Market Technicians Association, and editor of the MTA's newsletter, Technically Speaking. He is also the author of "Smarter Investing in Any Economy: The Definitive Guide to Relative Strength Investing," and "Conquering the Divide: How to Use Economic Indicators to Catch Stock Market Trends."
| Website: | www.moneynews.com/blogs/MichaelCarr/id-73 |
| E-mail address: | marketstrategist@gmail.com |
Click here for more information about our publications!
Comments

Request Information From Our Sponsors
- StockCharts.com, Inc.
- Candle Patterns
- Candlestick Charting Explained
- Intermarket Technical Analysis
- John Murphy on Chart Analysis
- John Murphy's Chart Pattern Recognition
- John Murphy's Market Message
- MurphyExplainsMarketAnalysis-Intermarket Analysis
- MurphyExplainsMarketAnalysis-Visual Analysis
- StockCharts.com
- Technical Analysis of the Financial Markets
- The Visual Investor
- VectorVest, Inc.
- Executive Premier Workshop
- One-Day Options Course
- OptionsPro
- Retirement Income Workshop
- Sure-Fire Trading Systems (VectorVest, Inc.)
- Trading as a Business Workshop
- VectorVest 7 EOD
- VectorVest 7 RealTime/IntraDay
- VectorVest AutoTester
- VectorVest Educational Services
- VectorVest OnLine
- VectorVest Options Analyzer
- VectorVest ProGraphics v6.0
- VectorVest ProTrader 7
- VectorVest RealTime Derby Tool
- VectorVest Simulator
- VectorVest Variator
- VectorVest Watchdog
