

HOT TOPICS LIST
- MACD
- Fibonacci
- RSI
- Gann
- ADXR
- Stochastics
- Volume
- Triangles
- Futures
- Cycles
- Volatility
- ZIGZAG
- MESA
- Retracement
- Aroon
INDICATORS LIST
LIST OF TOPICS
PRINT THIS ARTICLE
by Donald W. Pendergast, Jr.
"Buy high, sell higher" may not seem to be as appealing as "Buy low, sell high," but it's still a valid concept.
Position: N/A
Donald W. Pendergast, Jr.
Donald W. Pendergast is a financial markets consultant who offers specialized services to stock brokers and high net worth individuals who seek a better bottom line for their portfolios.
PRINT THIS ARTICLE
NEW HIGHS-NEW LOWS
Red Hat New Highs Keep Coming
11/02/11 08:49:33 AMby Donald W. Pendergast, Jr.
"Buy high, sell higher" may not seem to be as appealing as "Buy low, sell high," but it's still a valid concept.
Position: N/A
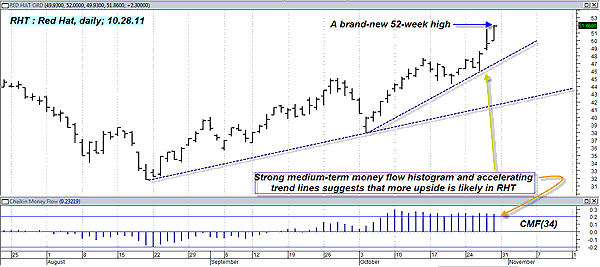
| Shares of Red Hat (RHT) are up nearly 58% since August 19, 2011, and the stock continues to blast out new 52-week highs with regularity. With the broad market looking more and more likely to achieve a sustainable rise between now and year-end, savvy traders might do well to take a closer look at RHT. |
|
| FIGURE 1: RED HAT, DAILY. Using a shorter-term moving average or trendline can be a simple and effective way to manage a covered-call position. |
| Graphic provided by: MetaStock. |
| |
| RHT's daily chart (Figure 1) looks bullish. With a set of accelerating uptrend lines defining the brute strength of the rally out of the August 2011 hole and strong medium-term Chaikin money flow (CMF)(34) to its technical credit, there appear to be few daily chart setups that can match this one for bullish potential. The key word is "potential," since we know that even the strongest trend can and does take a break every so often. That said, however, it might pay for traders to consider taking on a short-term RHT covered-call play, one that expires on the third Friday in November. With less than three weeks to expiration, one way to do the covered call (also known as a "buy-write," since you buy 100 shares (or multiples thereof) of stock and then write (sell) a call option against the position in hopes of generating extra income on the position trade is to sell a November $52.50 (slightly out-of-the-money) call against every 100 shares of RHT you acquire. With the powerful upward momentum in the stock as your primary profit driver, the idea here is to put on the position and then simply run a 21-day exponential moving average (EMA) as your initial/trailing stop until the stock makes a daily close below it. It's not the sexiest trade management arrangement, but you'd be surprised at how easy it can make it to monitor a covered-call trade -- especially with a strong uptrend in motion. You may feel more comfortable running a slightly shorter EMA length (do some testing and find out what works best) or even a longer one, depending on your assessment of the overall health of the stock and the broad market situation. |
| If at all possible, pay no more than $50.40 for the covered-call position. Here's the call option symbol for the November 52.5 call: RHT 111119C52.5 When a stock is moving up in an accelerating fashion, take a look at its trendworthiness and money flow characteristics; compare it to a variety of other stocks exhibiting similar characteristics and then consider buying a covered call on the best-looking ones of the lot. It might be time well spent and an activity well worth repeating. |
Donald W. Pendergast is a financial markets consultant who offers specialized services to stock brokers and high net worth individuals who seek a better bottom line for their portfolios.
| Title: | Writer, market consultant |
| Company: | Linear Trading Systems LLC |
| Jacksonville, FL 32217 | |
| Phone # for sales: | 904-239-9564 |
| E-mail address: | lineartradingsys@gmail.com |
Traders' Resource Links | |
| Linear Trading Systems LLC has not added any product or service information to TRADERS' RESOURCE. | |
Click here for more information about our publications!
PRINT THIS ARTICLE

Request Information From Our Sponsors
- VectorVest, Inc.
- Executive Premier Workshop
- One-Day Options Course
- OptionsPro
- Retirement Income Workshop
- Sure-Fire Trading Systems (VectorVest, Inc.)
- Trading as a Business Workshop
- VectorVest 7 EOD
- VectorVest 7 RealTime/IntraDay
- VectorVest AutoTester
- VectorVest Educational Services
- VectorVest OnLine
- VectorVest Options Analyzer
- VectorVest ProGraphics v6.0
- VectorVest ProTrader 7
- VectorVest RealTime Derby Tool
- VectorVest Simulator
- VectorVest Variator
- VectorVest Watchdog
- StockCharts.com, Inc.
- Candle Patterns
- Candlestick Charting Explained
- Intermarket Technical Analysis
- John Murphy on Chart Analysis
- John Murphy's Chart Pattern Recognition
- John Murphy's Market Message
- MurphyExplainsMarketAnalysis-Intermarket Analysis
- MurphyExplainsMarketAnalysis-Visual Analysis
- StockCharts.com
- Technical Analysis of the Financial Markets
- The Visual Investor