HOT TOPICS LIST
- MACD
- Fibonacci
- RSI
- Gann
- ADXR
- Stochastics
- Volume
- Triangles
- Futures
- Cycles
- Volatility
- ZIGZAG
- MESA
- Retracement
- Aroon
INDICATORS LIST
LIST OF TOPICS
PRINT THIS ARTICLE
by Alan R. Northam
This analysis shows that the trader must be careful in choosing the technical indicator to use when determining buy and sell signals.
Position: N/A
Alan R. Northam
Alan Northam lives in the Dallas, Texas area and as an electronic engineer gave him an analytical mind from which he has developed a thorough knowledge of stock market technical analysis. His abilities to analyze the future direction of the stock market has allowed him to successfully trade of his own portfolio over the last 30 years. Mr. Northam is now retired and trading the stock market full time. You can reach him at inquiry@tradersclassroom.com or by visiting his website at http://www.tradersclassroom.com. You can also follow him on Twitter @TradersClassrm.
PRINT THIS ARTICLE
TECHNICAL INDICATORS
Which Indicator?
11/02/11 08:39:57 AMby Alan R. Northam
This analysis shows that the trader must be careful in choosing the technical indicator to use when determining buy and sell signals.
Position: N/A
| Technical indicators in addition to the price chart of a security helps the trader determine when to buy and sell. In choosing an indicator, the trader has at his or her disposal a large arsenal of weapons. In choosing an indicator to use from this arsenal, the trader will most likely choose a popular indicator, or one he or she is most comfortable with. One such indicator is the relative strength index (RSI). So is this indicator as reliable in determining profitable buy and sell signals as its popularity suggests it should be? |
| To answer the question, let's do a test of the RSI. This test will be performed by using the default lookback period of 14 trading sessions. In addition, the RSI will be applied to each of the 30 Dow Jones Industrial Average (DJIA) stocks over the past five years. Further, both long and short trades will be included in the test. The result of this test will show the total profit of each security, the number of profitable trades versus the number of unprofitable trades, and the ratio of the average profitable to unprofitable trade determining the reward-risk ratio. To perform this test, the MetaStock Enhanced System Tester will be used. |
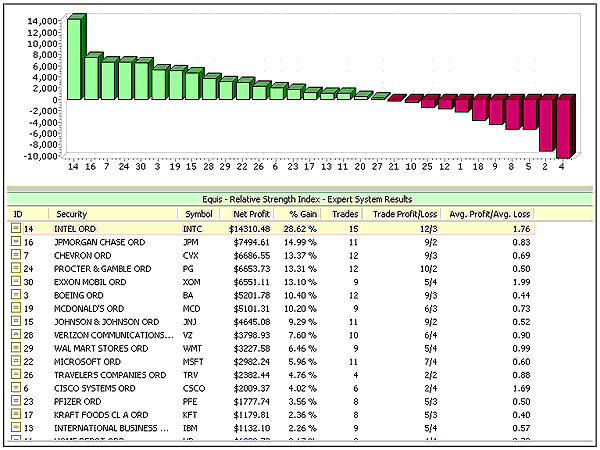
| Figure 1 shows the results of the scan. Each bar from left to right in the bar chart of Figure 1 represents one of the DJIA stocks. The most profitable stock using the RSI is Intel, with a total gain of 28.62%. Fifteen trades were made over the last five years, 12 of which were profitable and three unprofitable. Reward-risk ratio was 1.76 to 1. This means that on average, every dollar traded returned $1.76. Note, however, that as we move from left to right on the bar chart, the performance of each of the DJIA stocks degrades with the green bars representing those stocks that were profitable and the red bars representing those that were unprofitable. |

|
| FIGURE 1: ENHANCED SYSTEM TESTER WITHIN METASTOCK. Results show Intel as being the most profitable when using RSI(14) to determine buy & sell signals. |
| Graphic provided by: MetaStock. |
| |
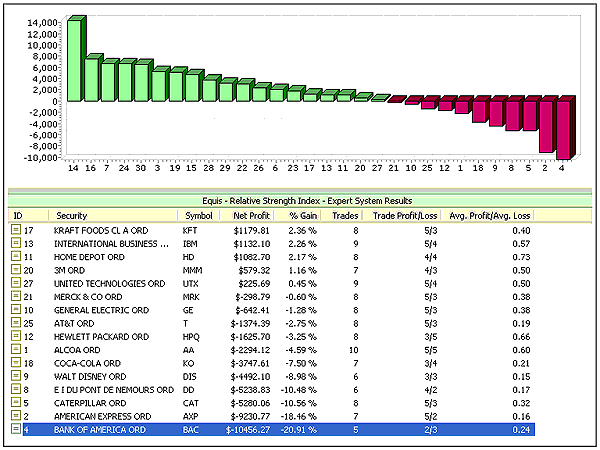
| Figure 2 shows the same bar chart. The difference between Figures 1 and 2 is the itemized list of the DJIA stocks. Figure 1 shows the first 15 stocks, whereas Figure 2 shows the last 15 stocks with some overlap in the list between the two figures. Note that 11 of the 30 DJIA stocks (almost half) did not show a profit over the last five years when using the RSI to determine buy and sell signals, with Bank of America the most unprofitable. In addition, note that only three of the DJIA stocks produced an average profit to average loss ratio greater than one (see Figure 1). This indicates that by using the RSI to determine buy and sell signals, the majority of stocks analyzed will most likely return less than one dollar for each dollar invested. |

|
| FIGURE 2: ENHANCED SYSTEM TESTER WITHIN METASTOCK. Results show Bank of America as being the most unprofitable when using RSI(14) to determine buy & sell signals. |
| Graphic provided by: MetaStock. |
| |
| While the RSI is a very popular indicator to use in determining buy & sell signals, its performance does not live up to its popularity. With only approximately half of the stocks selected showing a profit, a trader has a 50% chance of making a profit when using this indicator. In addition, in most of the cases, the reward returned for the risk taken is less than one, meaning that the trader will eventually lose all of his or her trading capital. The results of this test shows that while the RSI can be used successfully, the trader must be careful in choosing the indicator used in determining buy & sell signals. By simply choosing a popular indicator, the trader could be setting him- or herself up for failure and the eventual loss of all trading capital. |
Alan Northam lives in the Dallas, Texas area and as an electronic engineer gave him an analytical mind from which he has developed a thorough knowledge of stock market technical analysis. His abilities to analyze the future direction of the stock market has allowed him to successfully trade of his own portfolio over the last 30 years. Mr. Northam is now retired and trading the stock market full time. You can reach him at inquiry@tradersclassroom.com or by visiting his website at http://www.tradersclassroom.com. You can also follow him on Twitter @TradersClassrm.
| Garland, Tx | |
| Website: | www.tradersclassroom.com |
| E-mail address: | inquiry@tradersclassroom.com |
Click here for more information about our publications!
PRINT THIS ARTICLE

Request Information From Our Sponsors
- StockCharts.com, Inc.
- Candle Patterns
- Candlestick Charting Explained
- Intermarket Technical Analysis
- John Murphy on Chart Analysis
- John Murphy's Chart Pattern Recognition
- John Murphy's Market Message
- MurphyExplainsMarketAnalysis-Intermarket Analysis
- MurphyExplainsMarketAnalysis-Visual Analysis
- StockCharts.com
- Technical Analysis of the Financial Markets
- The Visual Investor
- VectorVest, Inc.
- Executive Premier Workshop
- One-Day Options Course
- OptionsPro
- Retirement Income Workshop
- Sure-Fire Trading Systems (VectorVest, Inc.)
- Trading as a Business Workshop
- VectorVest 7 EOD
- VectorVest 7 RealTime/IntraDay
- VectorVest AutoTester
- VectorVest Educational Services
- VectorVest OnLine
- VectorVest Options Analyzer
- VectorVest ProGraphics v6.0
- VectorVest ProTrader 7
- VectorVest RealTime Derby Tool
- VectorVest Simulator
- VectorVest Variator
- VectorVest Watchdog
