HOT TOPICS LIST
- MACD
- Fibonacci
- RSI
- Gann
- ADXR
- Stochastics
- Volume
- Triangles
- Futures
- Cycles
- Volatility
- ZIGZAG
- MESA
- Retracement
- Aroon
INDICATORS LIST
LIST OF TOPICS
PRINT THIS ARTICLE
by Billy Williams
A stock from the past is about to make headlines again in a bullish run that could last months or even years.
Position: Buy
Billy Williams
Billy Williams has been trading the markets for 27 years, specializing in momentum trading with stocks and options.
PRINT THIS ARTICLE
STOCKS
Old Hat Becomes Red Hot...Again
11/01/11 09:45:54 AMby Billy Williams
A stock from the past is about to make headlines again in a bullish run that could last months or even years.
Position: Buy
| The market rocketed out of the gate at the open and racked up some stunning gains, ushering in a rising tide of new breakouts among stocks. The announcement by the European Union (EU) on a consensus to help out Greece was a massive shot in the arm to the global markets, as it will indirectly help Italy from feeling the bone-crunching burden of the debt on the part of many of the EU members who are trying to head off a debt crisis, while many are desperately trying to tear the albatross of insolvency from around their necks and get back to strengthening their individual economies. While the true effects of the deal will be argued out over the coming weeks as the market prices in its effects, a stock from the past is once again about to make headlines. Red Hat, Inc. (RHT), provides open-source software solutions to enterprises worldwide. It also offers enterprise-ready open source operating system platforms. The company sells its enterprise technologies through subscriptions and has strategic alliances with Advanced Micro Devices and Intel Corp. The company was founded in 1993 and is headquartered in Raleigh, NC. See Figure 1. |

|
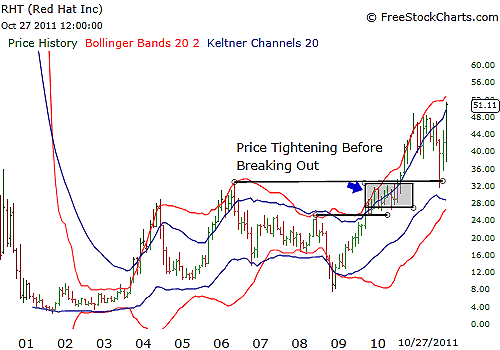
| FIGURE 1: RHT, MONTHLY. The squeeze pattern occurs when the Bollinger Bands are drawn within the Keltner channels, revealing a drop in volatility. But when it emerges outside the Keltner channels on a monthly chart, the move can last for months or years as price explodes in a given direction. |
| Graphic provided by: www.freestockcharts.com. |
| |
| RHT went public in early 2000, only to find its price action fall and meander for a number of years. With its price gasping for life like a fish on a riverbank, RHT began to enter a squeeze in October 2002 (Figure 2). A squeeze pattern is when the Bollinger Bands and Keltner channels are placed on a chart and the Bollinger Bands begin to contract within the Keltner channels, signaling that volatility is contracting. Since volatility always reverts to its mean, price is biased to explode out of this constricted price range and move into high-velocity price expansion, which RHT did in December 2003 when, on the RHT's monthly price chart, the Bollinger Bands emerged out of the Keltner channels and price followed. The upward move was short-lived, however, and price began to falter again but still managed to trade in a higher price range. |

|
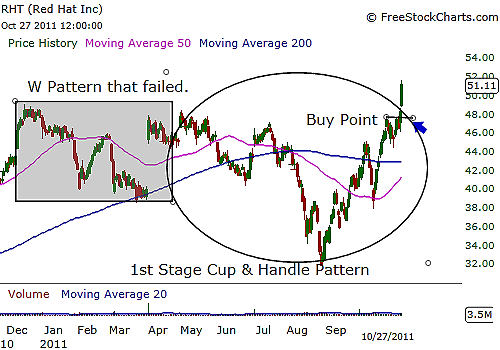
| FIGURE 2: RHT. RHT has recently formed a W pattern, but price undercut that pattern's low and then formed a new first stage basing pattern in the form of a cup & handle pattern. A buy signal was confirmed yesterday at $47.79 and with the squeeze pattern behind it along with the overall market gaining steam, RHT could be a huge winner in the months and years to come. |
| Graphic provided by: www.freestockcharts.com. |
| |
| At the end of 2007, RHT once again entered into a squeeze pattern on its monthly charts and emerged in November 2008 to the downside but quickly reversed and traded up through its price highs in September 2009 and then on to all-time highs in July 2010. Monthly squeeze patterns tend to last a long time once its move begins and could last for years to come. Though RHT has stumbled back and forth, its price is now trading upward with high relative strength with the wind at its back as the overall market gathers steam, now that it has traded upward and through its 200-day simple moving average (SMA) today. |
| If that wasn't compelling enough, RHT has formed a first-stage base in the form of a cup & handle pattern and signaled an entry at $47.79. If you missed the entry, look for a pullback or a slight consolidation period of five to seven trading days and then catch an entry as the stock trades higher. |
Billy Williams has been trading the markets for 27 years, specializing in momentum trading with stocks and options.
| Company: | StockOptionSystem.com |
| E-mail address: | stockoptionsystem.com@gmail.com |
Traders' Resource Links | |
| StockOptionSystem.com has not added any product or service information to TRADERS' RESOURCE. | |
Click here for more information about our publications!
PRINT THIS ARTICLE

Request Information From Our Sponsors
- StockCharts.com, Inc.
- Candle Patterns
- Candlestick Charting Explained
- Intermarket Technical Analysis
- John Murphy on Chart Analysis
- John Murphy's Chart Pattern Recognition
- John Murphy's Market Message
- MurphyExplainsMarketAnalysis-Intermarket Analysis
- MurphyExplainsMarketAnalysis-Visual Analysis
- StockCharts.com
- Technical Analysis of the Financial Markets
- The Visual Investor
- VectorVest, Inc.
- Executive Premier Workshop
- One-Day Options Course
- OptionsPro
- Retirement Income Workshop
- Sure-Fire Trading Systems (VectorVest, Inc.)
- Trading as a Business Workshop
- VectorVest 7 EOD
- VectorVest 7 RealTime/IntraDay
- VectorVest AutoTester
- VectorVest Educational Services
- VectorVest OnLine
- VectorVest Options Analyzer
- VectorVest ProGraphics v6.0
- VectorVest ProTrader 7
- VectorVest RealTime Derby Tool
- VectorVest Simulator
- VectorVest Variator
- VectorVest Watchdog
